The December Trade Deficit increased after a major drop in November. The total came in at $67B which was 10% greater than November’s $61B, but still well below the 6-month high from October of $77B. It is also below the $79B Trade Deficit from December 2021.
This article was originally published by Schiff Gold.
As shown below, the Trade Deficit has definitely come down quite a bit since the string of monthly deficits that all exceeded $80B from January to June of 2022.
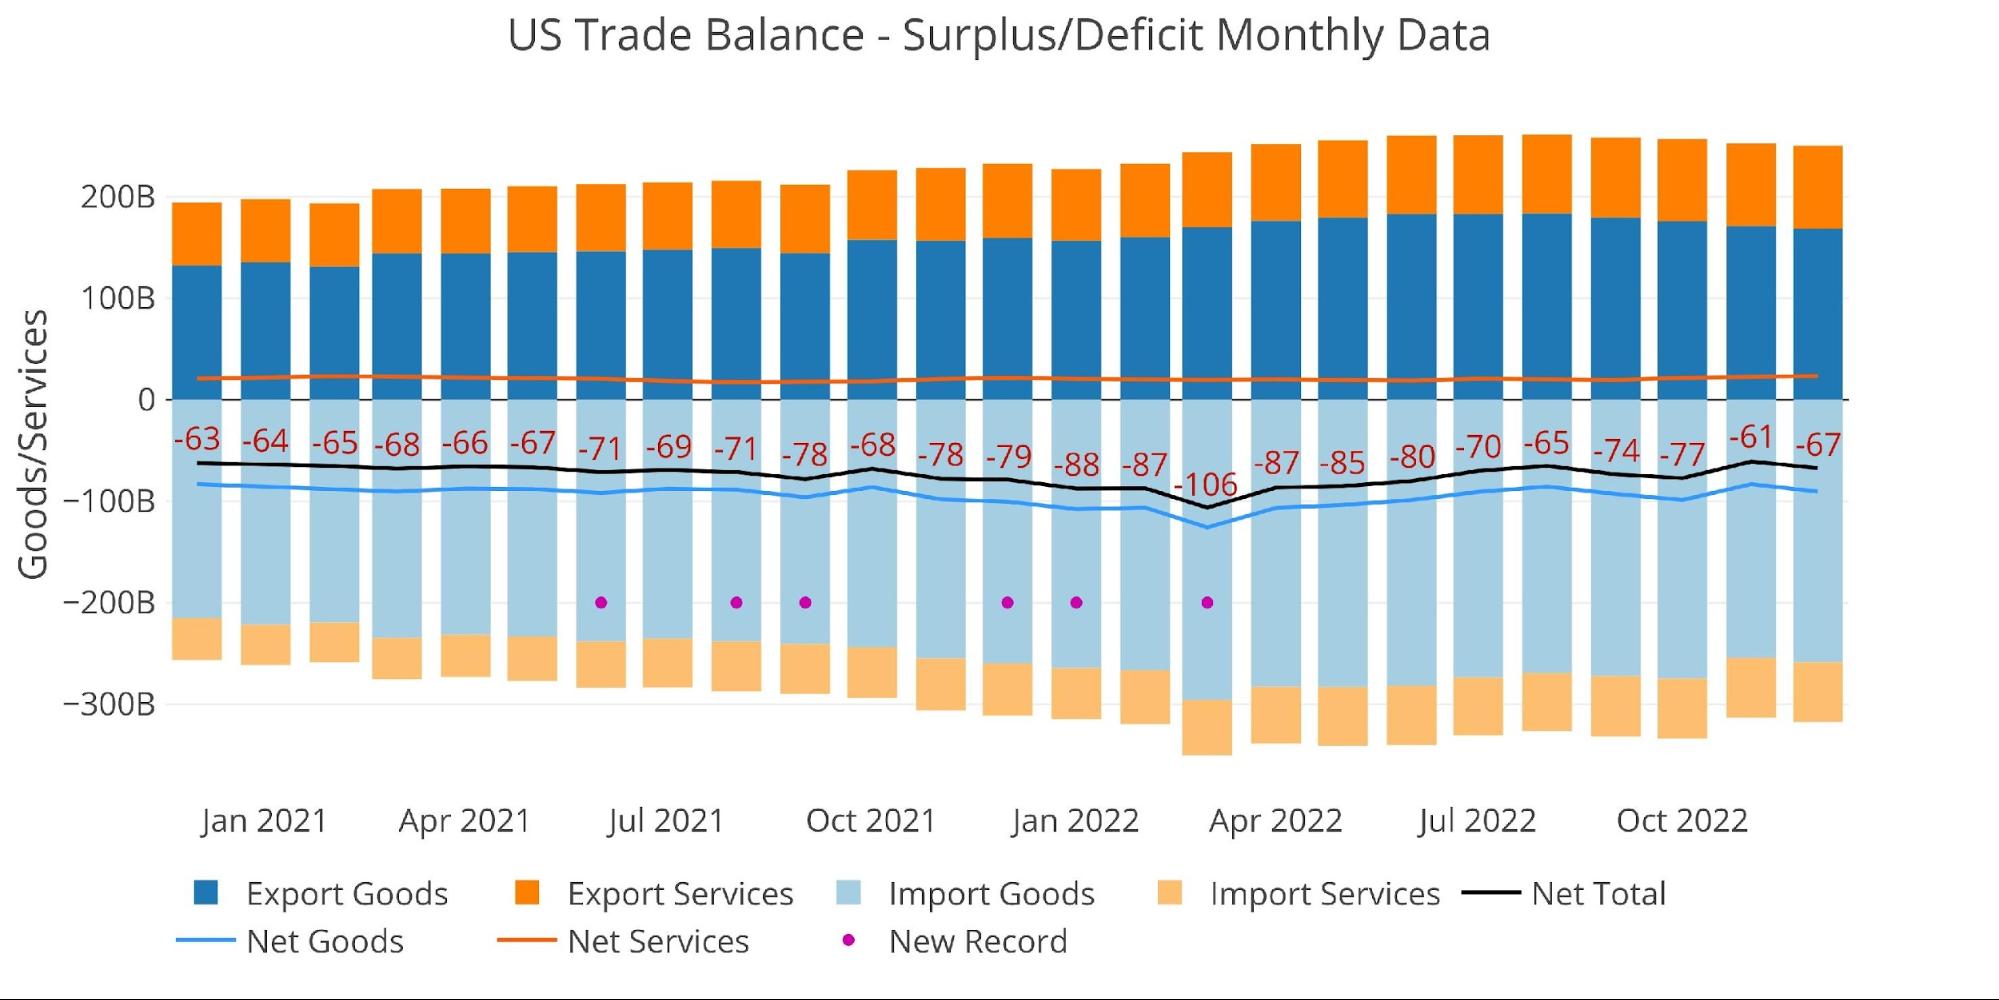
Figure: 1 Monthly Plot Detail
The table below provides detail.
Monthly Trade Deficit
-
- YoY Goods Exported increased 5.5% while Services Exported increased 12.2%
- Imported Goods actually fell while Imported Services surged 14.4%
- On a net basis, the Goods Deficit surged 8.9% MoM but fell 9.8% YoY
- The Services Surplus grew MoM 4.7% and YoY 7.2%
Looking at Trailing Twelve Month:
-
- The TTM Net Deficit increased from -$845B last year to -$948B for the TTM period ending Dec 2022
- MoM the TTM Net Deficit fell from -$982B
- The TTM Services Surplus fell by 0.6%
- At an aggregate level, Exports/Imports and Goods/Services all increased by more than 15%!
Similar to the recent jobs report, the Trade Deficit might initially signal a strengthening economy where Exports are growing and Imports are falling. While the BLS Jobs numbers made little sense given the economic environment, the improving Trade Deficit could be explained by the fall in the dollar along with a rise in global inflation.
As the dollar falls in value, US exports become cheaper to the rest of the world. Similarly, Imports become more expensive. However, as shown below, the fact that all categories have surged by such an incredible margin (15%+) in a weakening economy suggests that fewer goods are being consumed for significantly more. Even if goods consumption remained flat in 2022 (very unlikely compared to 2021), then the Trade Deficit would indicate global inflation well into the double digits. Double-digit inflation seems like the most likely explanation for the large growth.
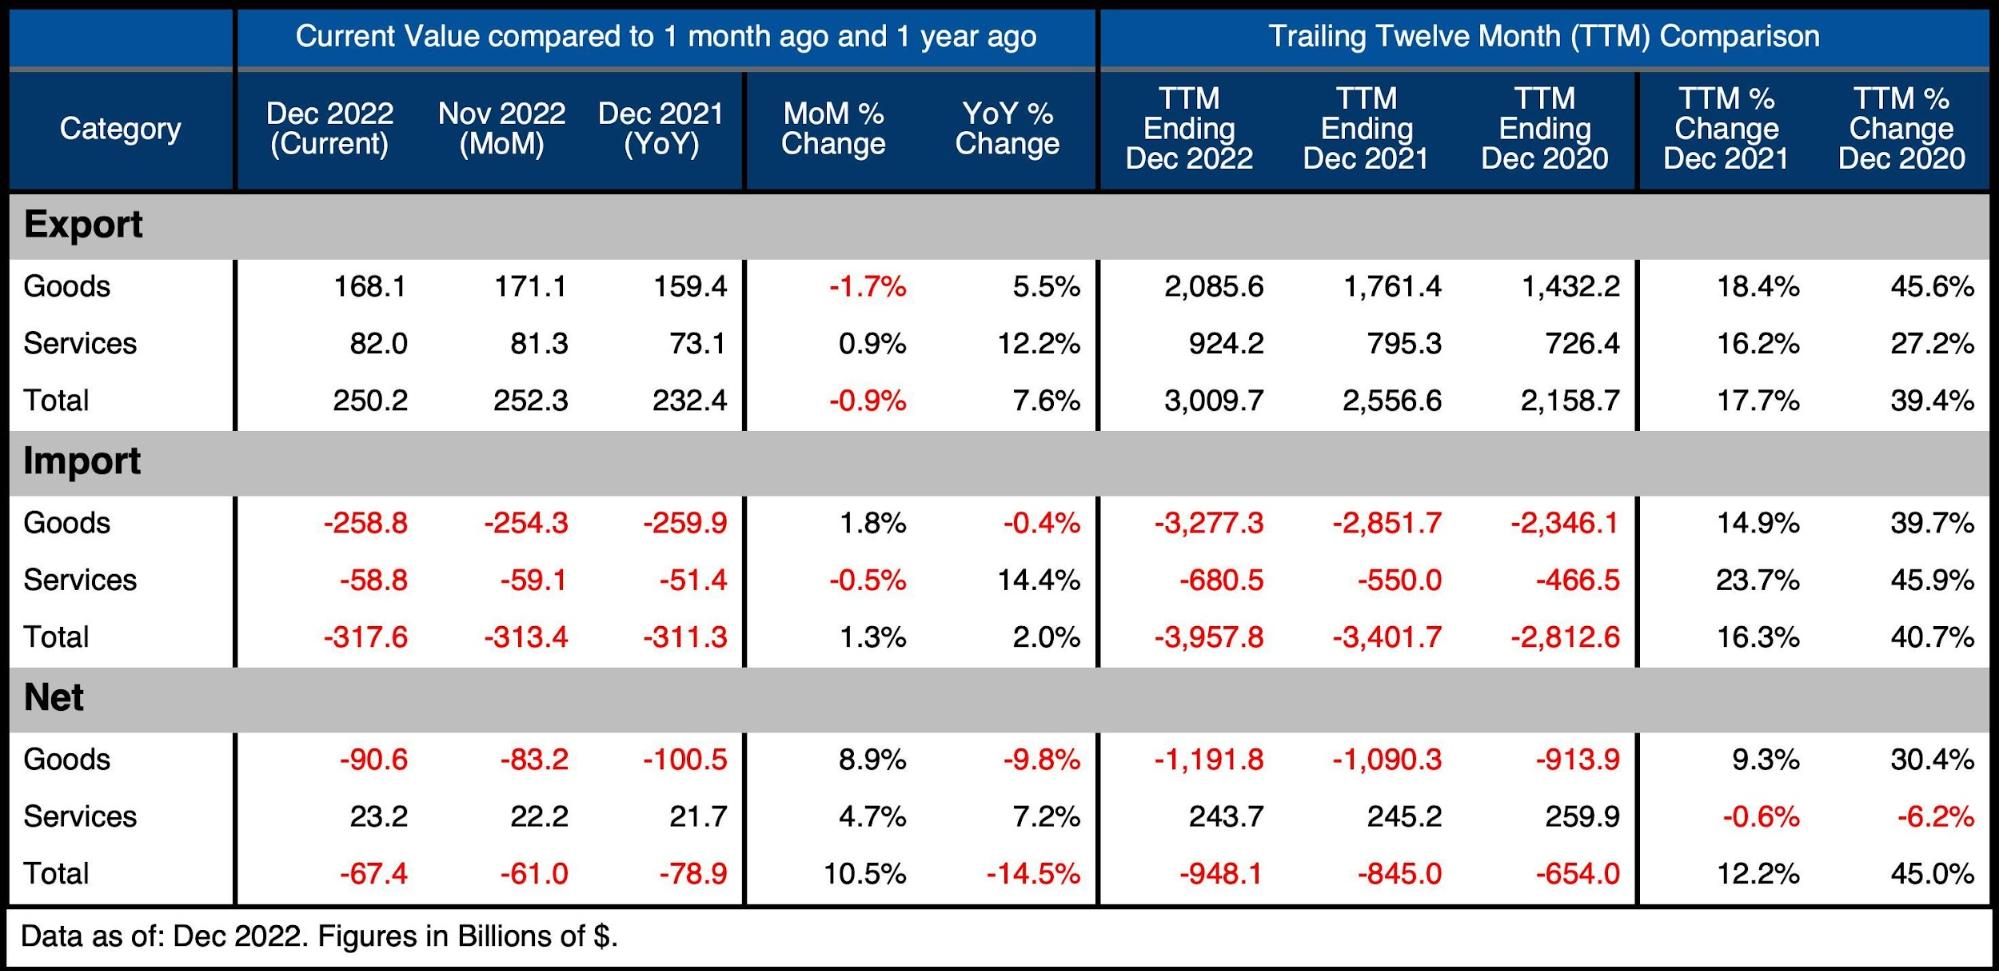
Figure: 2 Trade Balance Detail
Historical Perspective
Zooming out and focusing on the net numbers shows the longer-term trend. The massive Deficit spike in March was fully reversed, but it has now come back in line with the downward trend that had been ongoing before Covid.
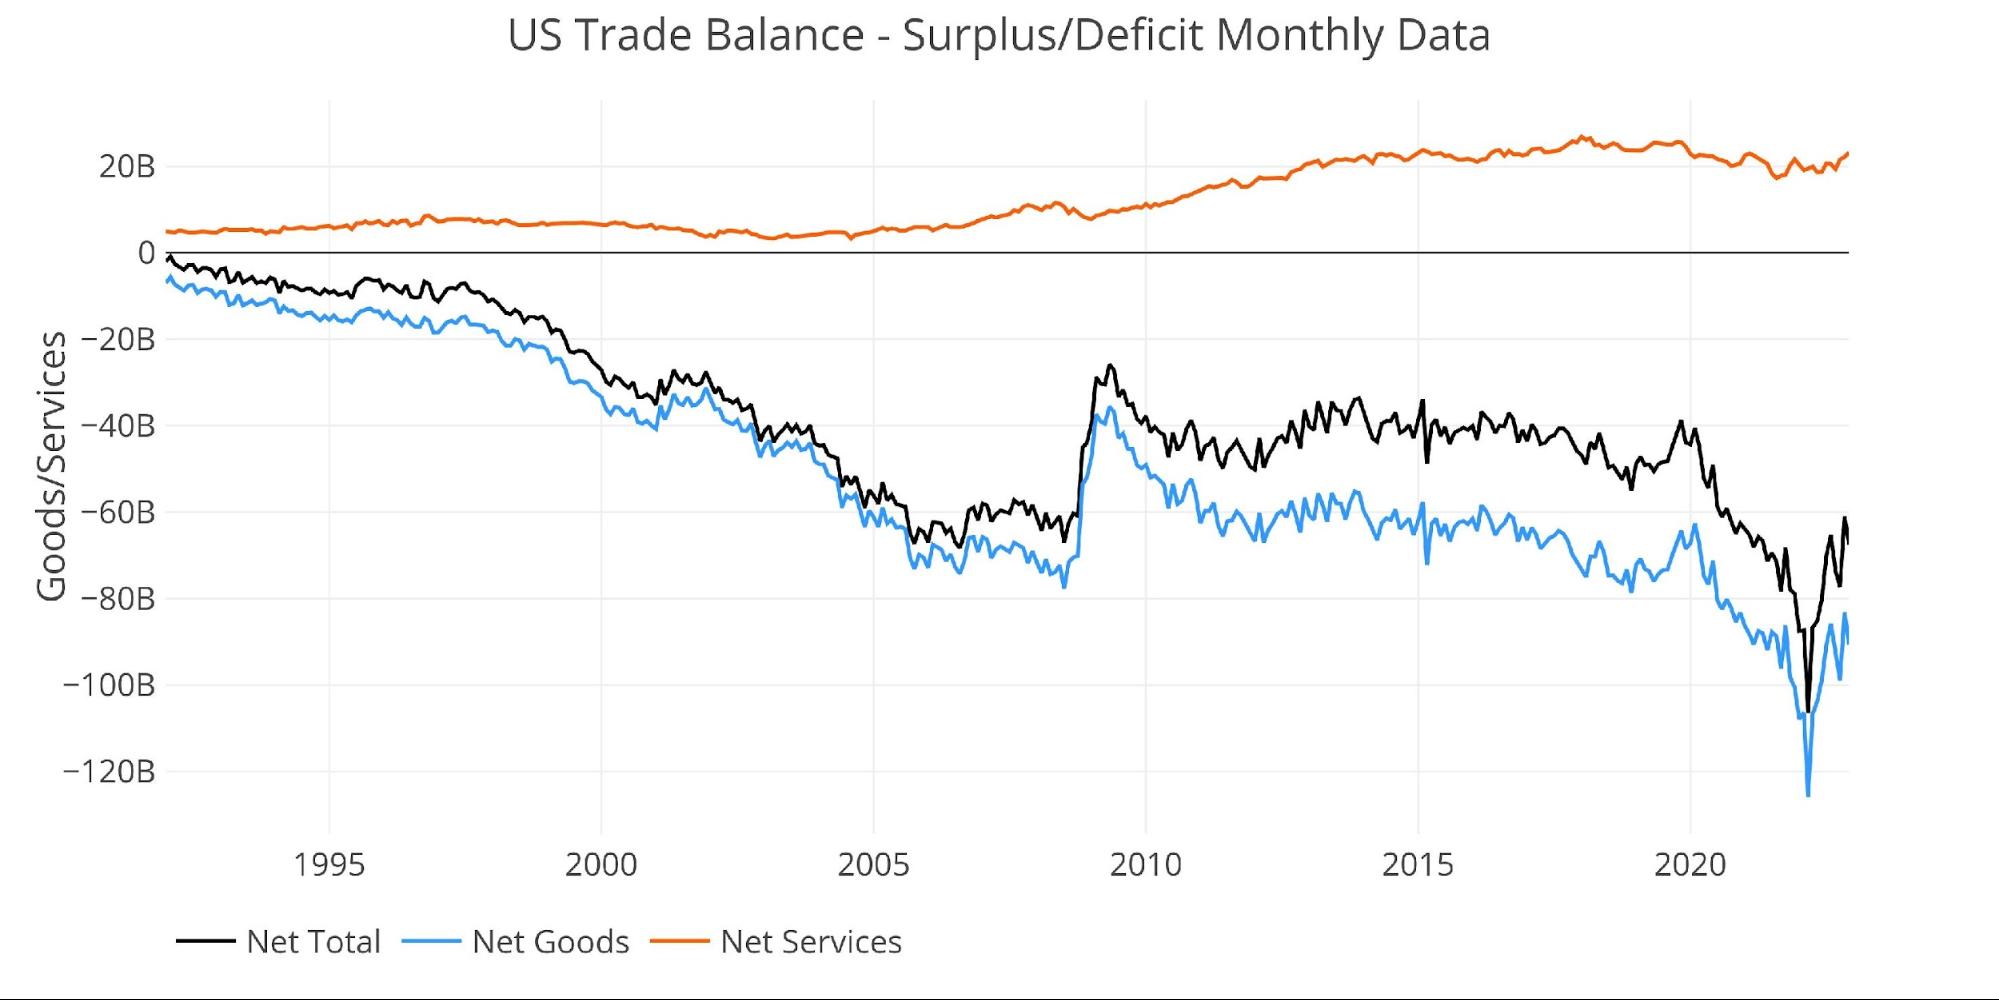
Figure: 3 Historical Net Trade Balance
The chart below zooms in on the Services Surplus to show the wild ride it has been on in recent months. It compares Net Services to Total Exported Services to show relative size. After hovering near 35% since 2013, it dropped below 30% in July last year. It has rebounded to 28.3% in the latest month, up from 24.6%, which is another factor helping reduce the Trade Deficit.
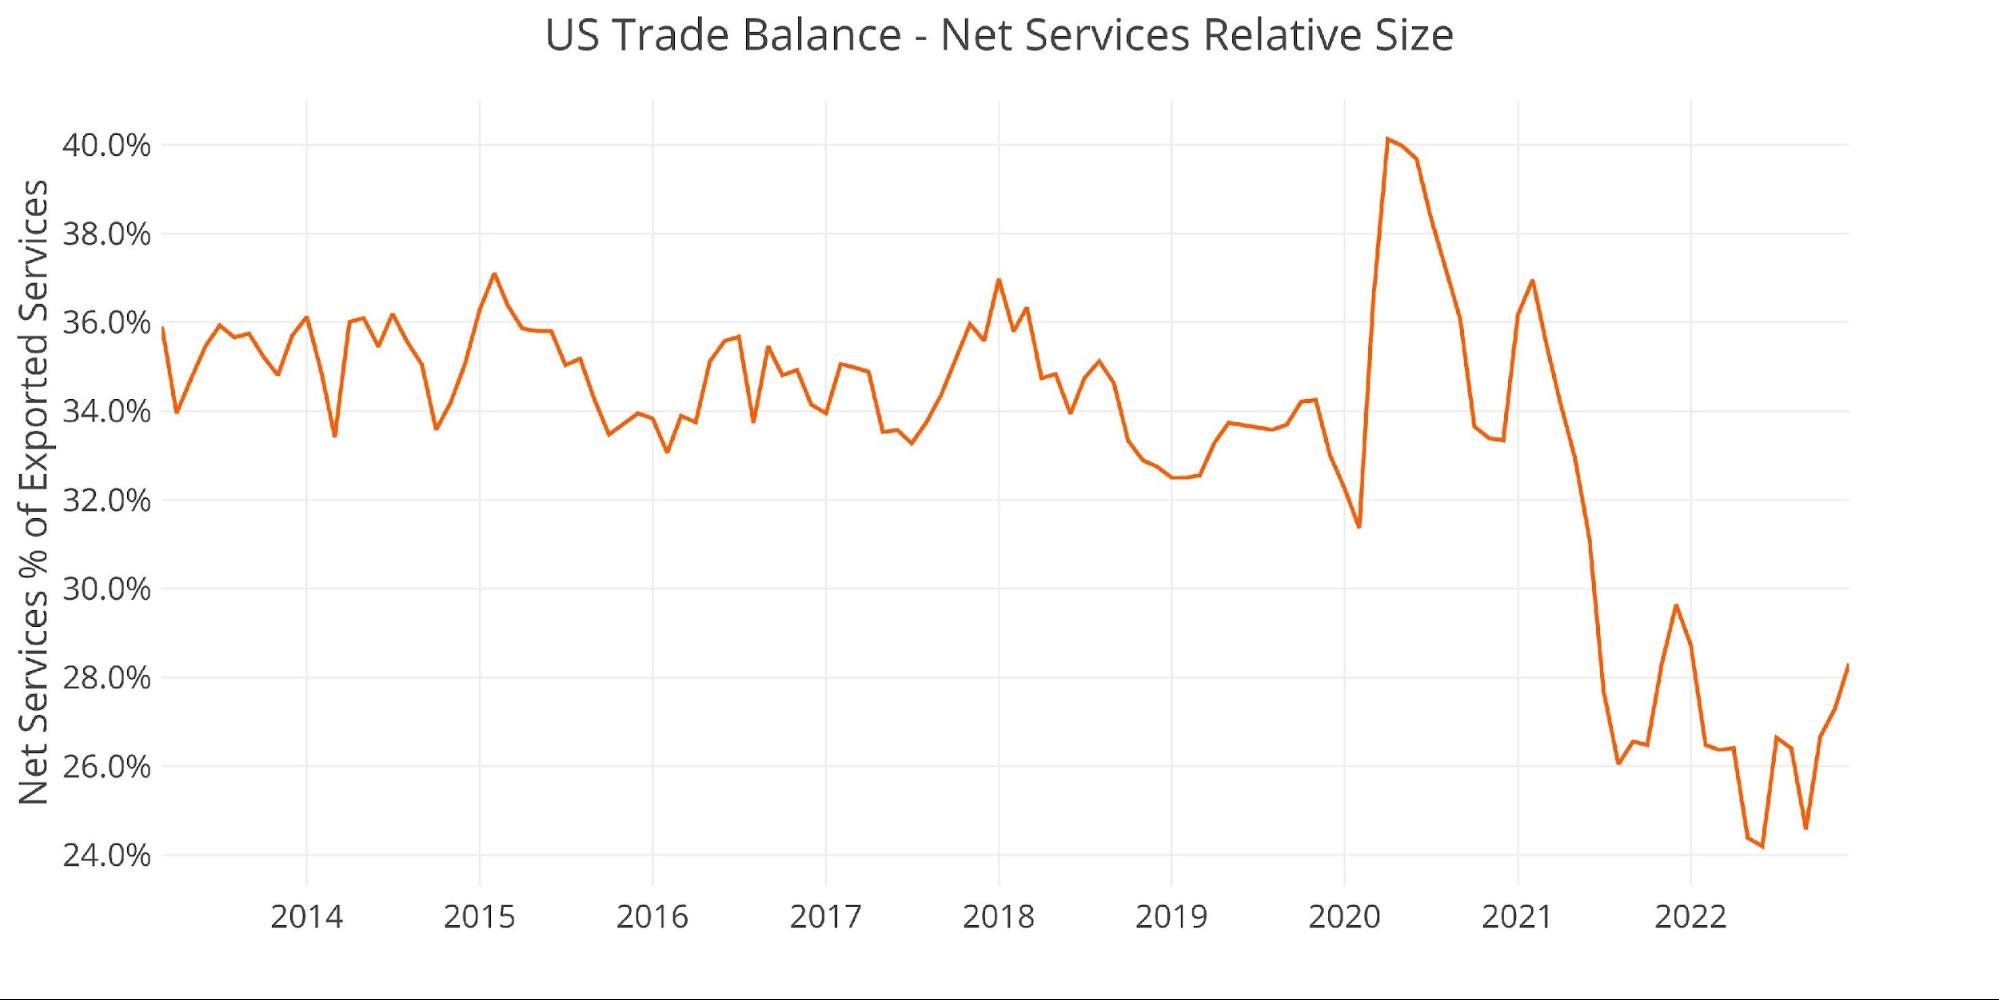
Figure: 4 Historical Services Surplus
To put it all together and remove some of the noise, the next plot below shows the Trailing Twelve Month (TTM) values for each month (i.e., each period represents the summation of the previous 12 months).
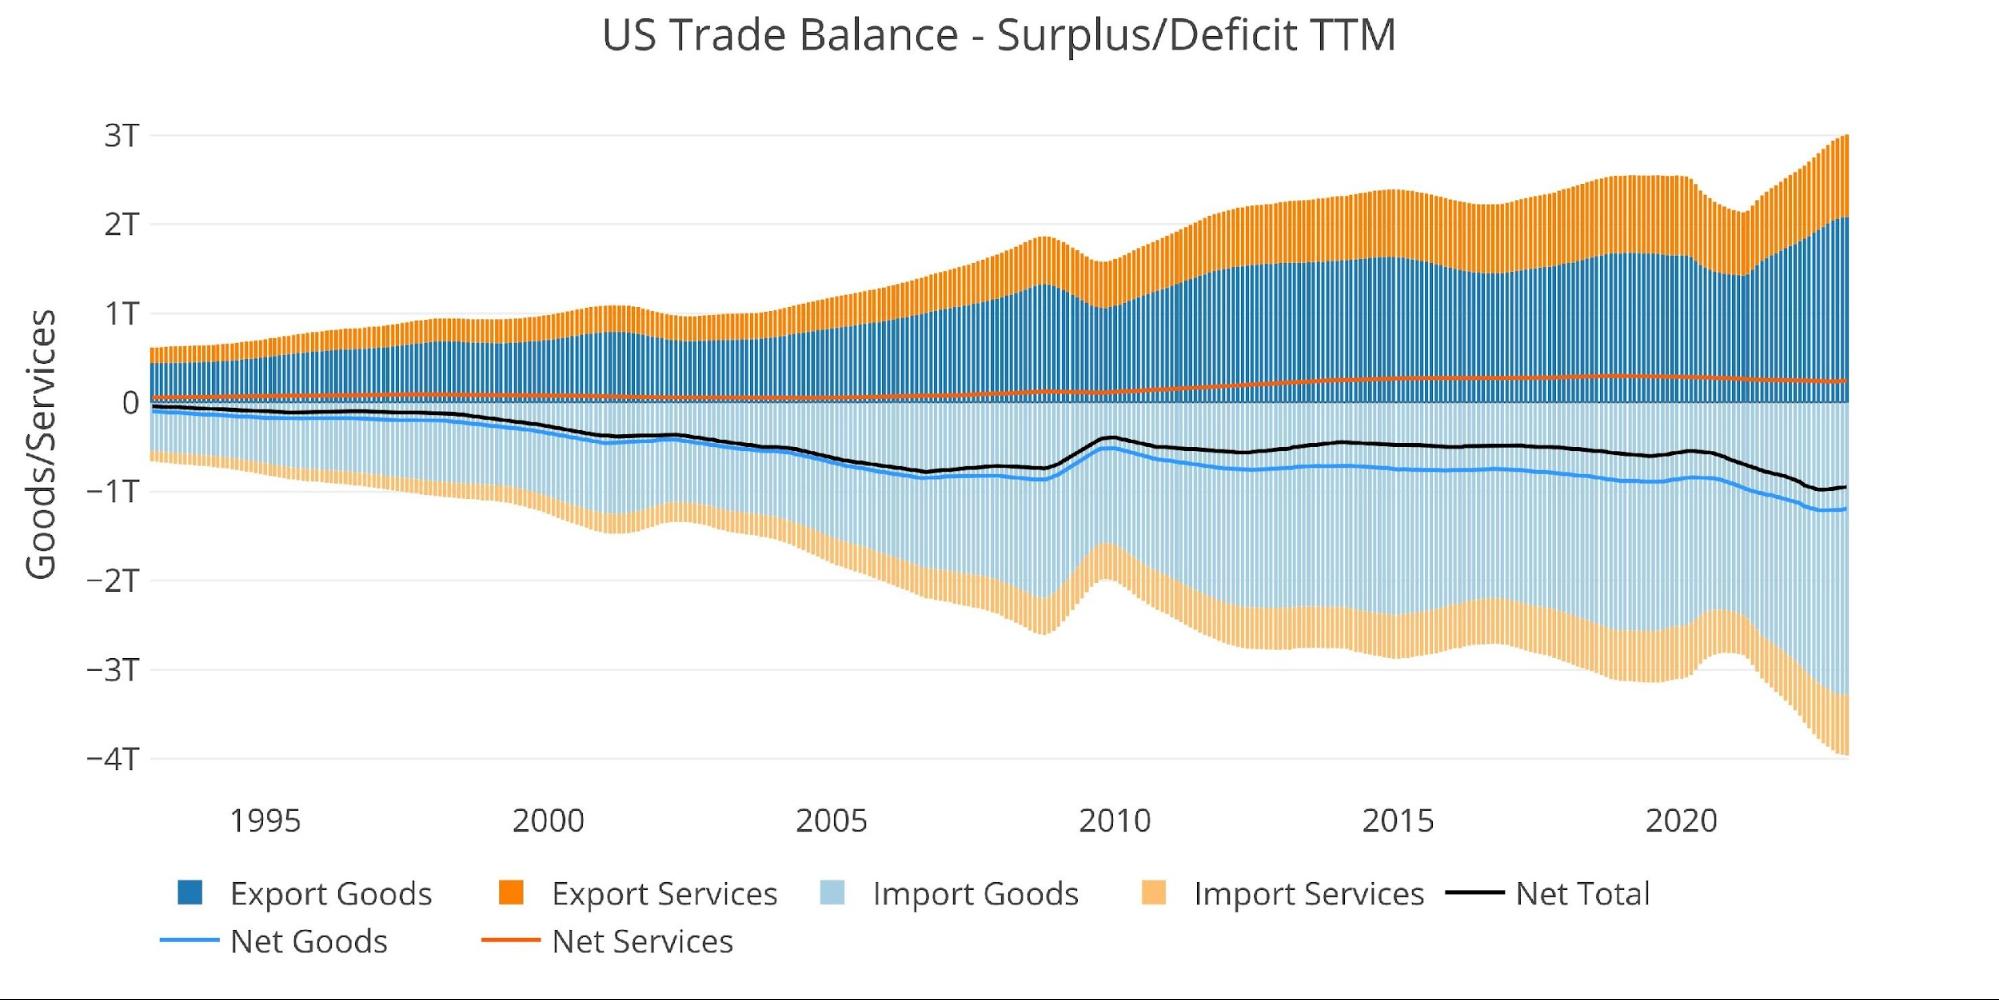
Figure: 5 Trailing 12 Months (TTM)
Although the TTM Net Trade Deficit is near historical highs, it can be put in perspective by comparing the value to US GDP. As the chart below shows, the current records are still below the 2006 highs before the Great Financial Crisis.
The current 3.63% is moving back down but is still well above the 2.5% from before Covid.
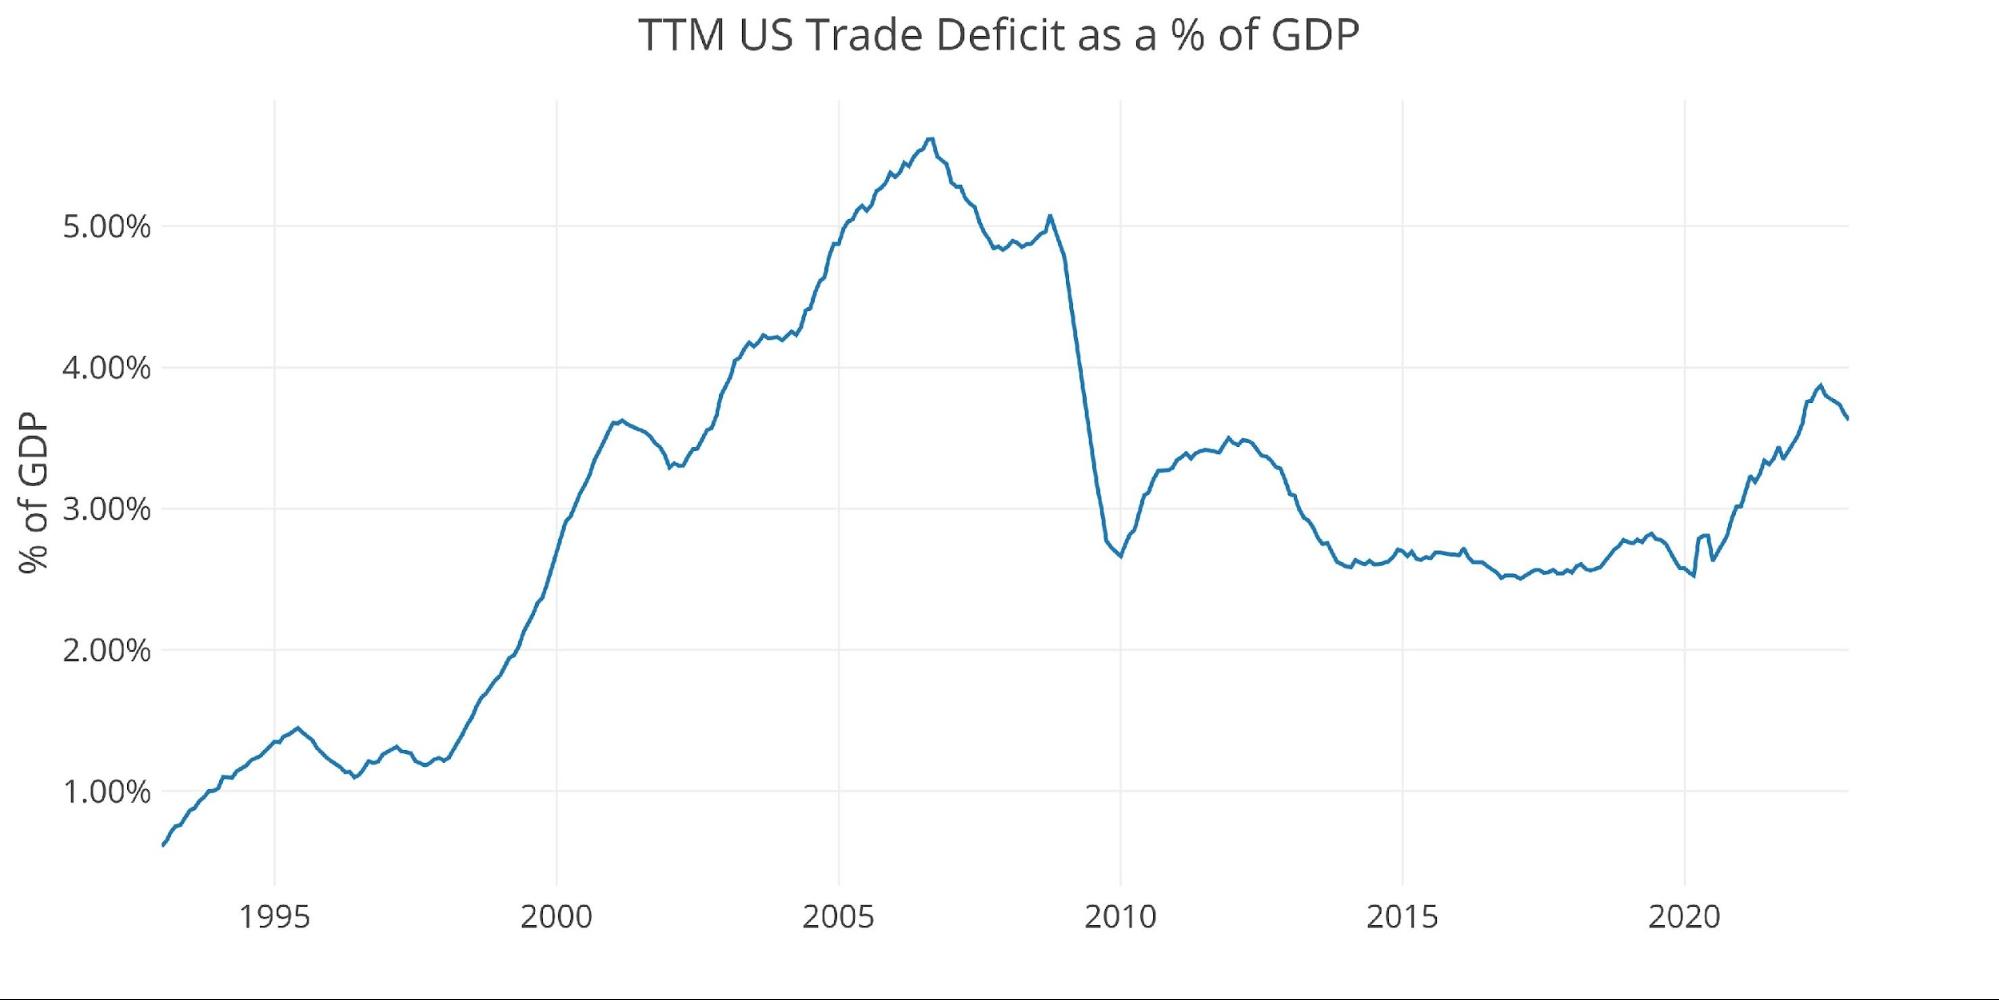
Figure: 6 TTM vs GDP
The chart below shows the YTD values. Because the latest month is December, these are full-year figures. 2022 is well above prior years by a significant margin. As mentioned above, most or even all of this increase could be directly tied to the global rise in inflation.
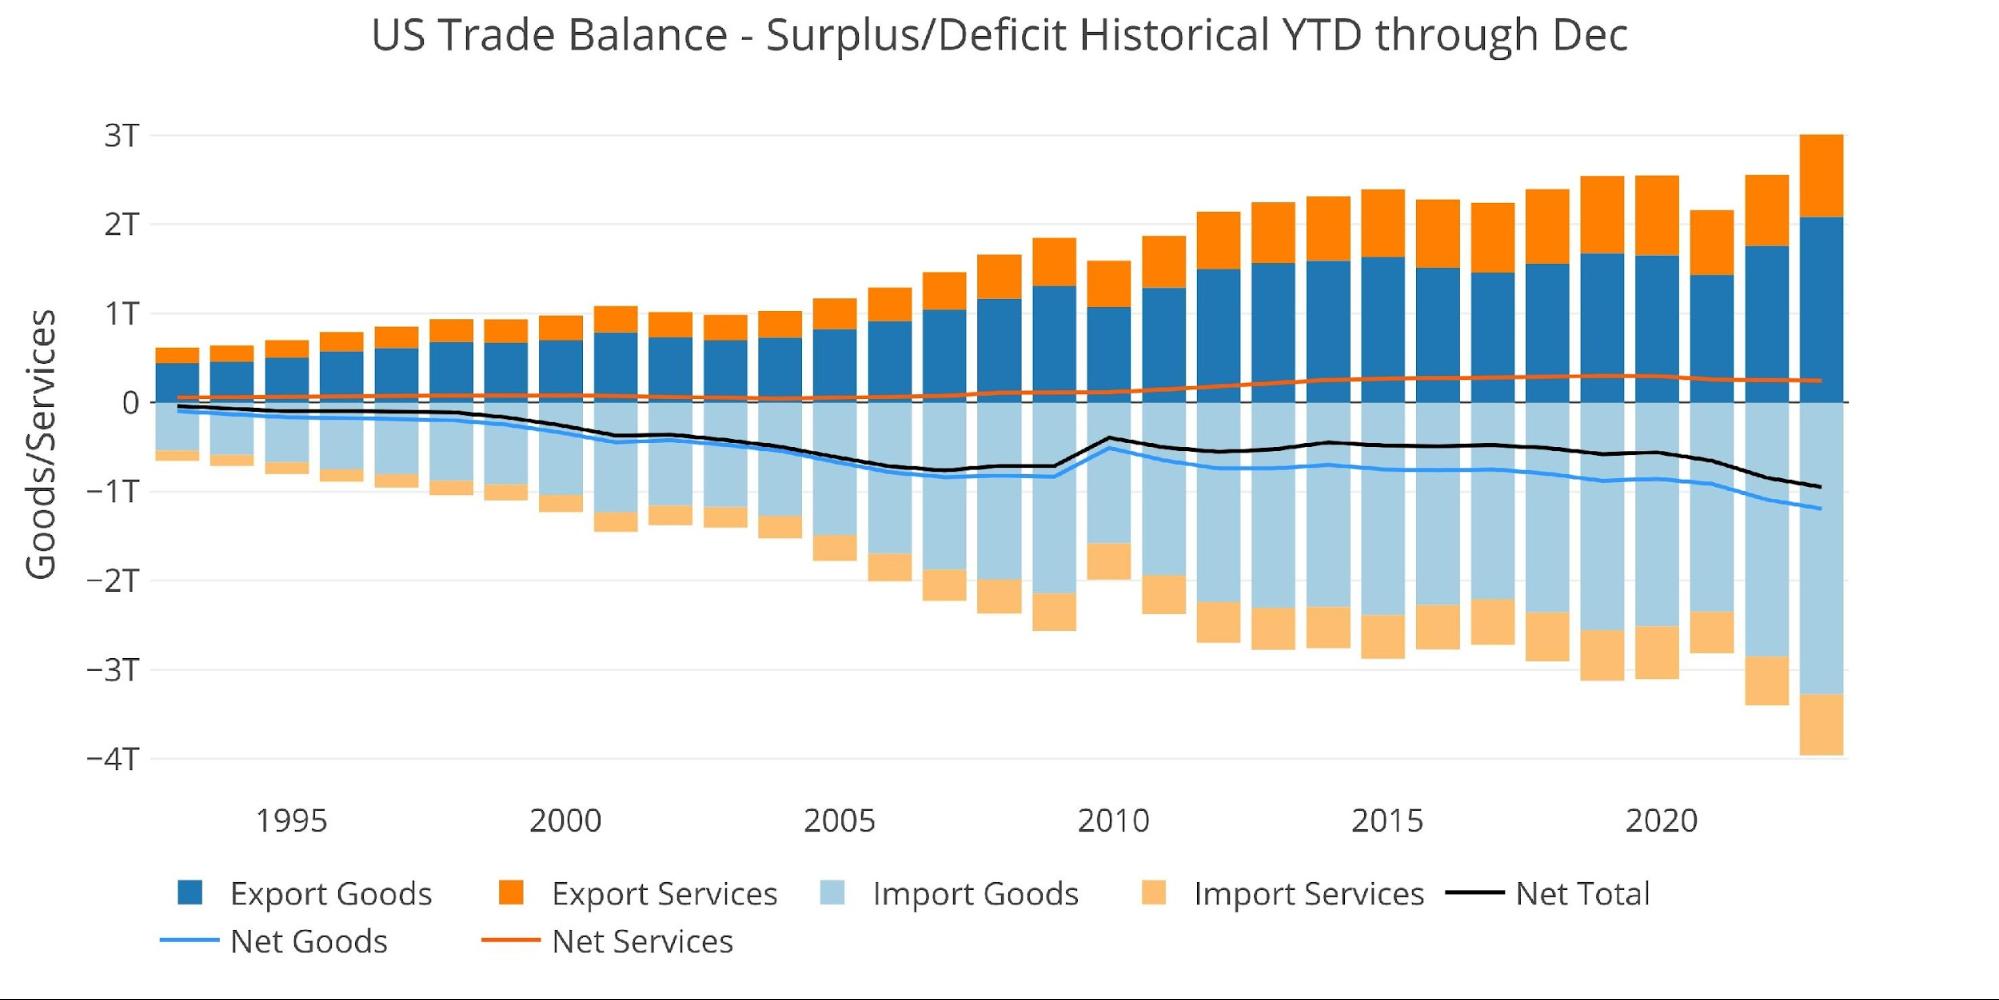
Figure: 7 Year to Date
What it means for Gold and Silver
The Trade Deficit represents how much paper the US is trading for physical goods. The Deficit sits near all-time highs, which means the US dollar continues to be sent abroad in record amounts. The Trade Deficit has improved in recent months, but this is likely more due to the falling dollar and less from a burgeoning US economy.
The current weak economy suggests that goods consumption was probably flat or down, people are just paying more for everything. 15% more! A falling dollar with higher inflation is a world where gold will offer the best protection.