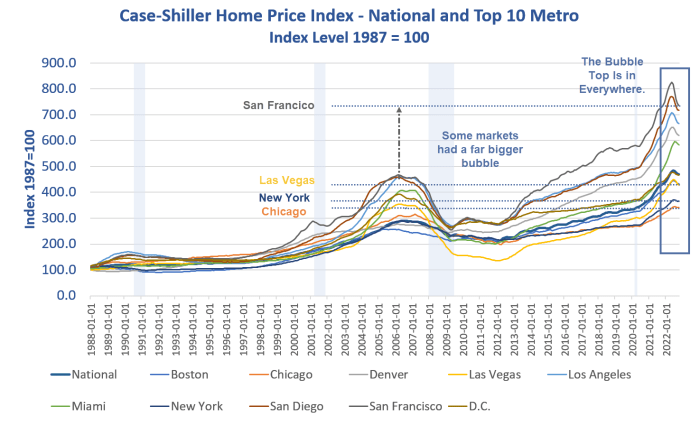
The latest Case-Shiller numbers came out today. They are for October representing data for three months prior, this very lagging.
This article was originally published by Mish Talk.
Home Price Synopsis
- Home prices have peaked this cycle but the decline is certainly tiny compared to the run up.
- Case-Shiller data lags. The latest data is from October and that represents sales primarily made in July, August, and September so the declines shown are undoubtedly understated by a lot, depending on the market.
- Declines will accelerate but not fast enough to revive a housing market that has soured dramatically.
CS National ,Top 10 Metro, CPI, OER Index Levels
Chart Notes
- OER stands for Owner’s Equivalent Rent. It it the price one would pay to rent a home, unfurnished and without utilities.
- Home prices wildly disconnected from the CPI in 2000 and in 2013. The disconnect accelerated in 2020.
The Fed ignored all three occasions hoping to make up for “lack of inflation”. The Fed “succeeded” beyond it’s wildest dreams.
CS National, Top 10 Metro, CPI, OER Percent Change
The year-over-year CPI has finally peaked this cycle as have home prices. I added a new chart to show year-over-year home prices in the 10 top markets.
Case-Shiller Home Prices Percent Change Year-Over-Year
Home prices are falling fast in every market with San Francisco leading the way and Miami lagging badly.
Year-Over-Year Percent Changes by City
- Boston: 7.66
- Chicago: 8.84
- Denver: 7.94
- Las Vegas: 9.42
- Los Angeles: 6.63
- Miami: 21.04
- New York: 9.34
- San Diego: 7.57
- San Francisco: 0.66
- D.C: 6.00
- National: 9.24
- 10-City Average: 8.01
Don’t believe any of that. Those prices are very stale.
I suspect that at a minimum, San Francisco, San Diego, and Los Angeles are all in the red with many more cities approaching that level.
Zillow Comparison
Zillow says that prices in 99 percent of the nations 400 largest housing markets are still up year-over-year.
I do not believe that either although Zillow claims its methodology is more timely.
For discussion, please see How Accurate are Zillow Year-Over-Year Home Price Estimates?
Amusingly, last month Zillow said the home price correction is over. Zillow then retracted that statement but is still talking about a bottom near at hand.
What a hoot. Zillow is acting like a housing cheerleader even more so than the National Association of Realtors.


