
Long commutes are a defining feature of life in many U.S. metro areas, where housing affordability, traffic congestion, and job concentration push workers farther from employment hubs.
This article was written by Niccolo Conte and originally published by Visual Capitalist.
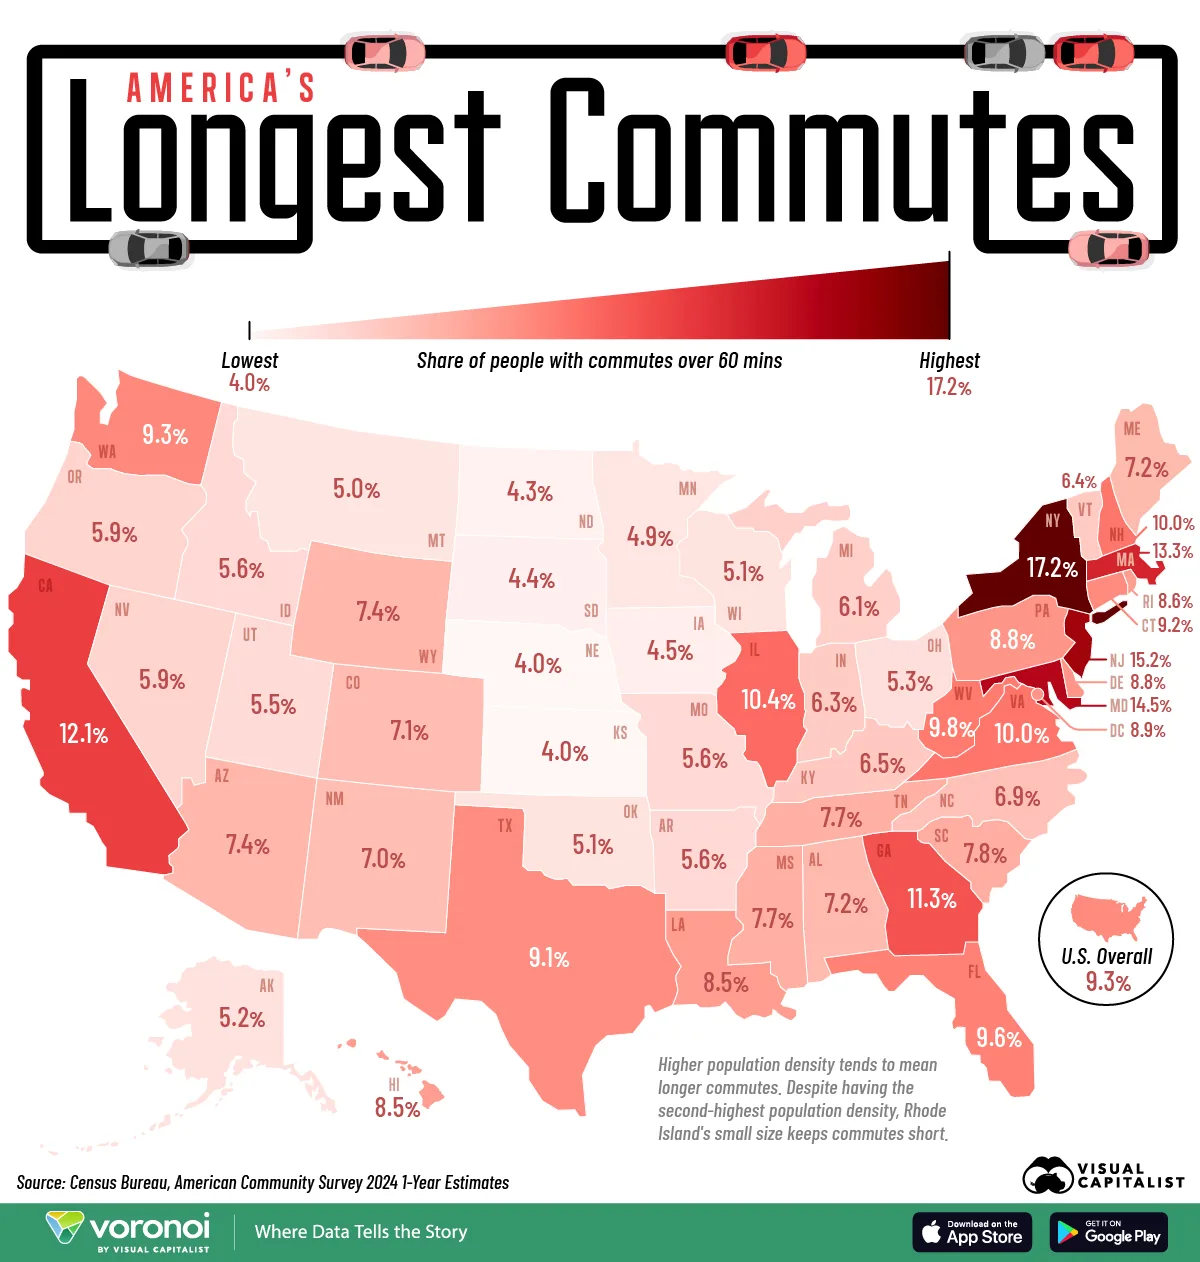
This map shows the share of commuters in each U.S. state with a one-way commute longer than 60 minutes, using data from the U.S. Census Bureau’s American Community Survey (ACS) 2024 1-Year Estimates.
States With the Worst Commutes
The longest commutes are heavily concentrated in the Northeast, where dense populations and interconnected metro areas make extended travel times more common. New York leads, with 17.2% of commuters traveling more than an hour each way.
The table below ranks states by the share of commuters with hour-long commutes:
|
Rank
|
Name
|
Share of commuters with >60 minute commute
|
|---|---|---|
| 1 | New York | 17.2% |
| 2 | New Jersey | 15.2% |
| 3 | Maryland | 14.5% |
| 4 | Massachusetts | 13.3% |
| 5 | California | 12.1% |
| 6 | Georgia | 11.3% |
| 7 | Illinois | 10.4% |
| 8 | New Hampshire | 10.0% |
| 9 | Virginia | 10.0% |
| 10 | West Virginia | 9.8% |
|
Rank
|
Name
|
Share of commuters with >60 minute commute
|
|---|---|---|
| 11 | Florida | 9.6% |
| 12 | Washington | 9.3% |
| 13 | Connecticut | 9.2% |
| 14 | Texas | 9.1% |
| 15 | District of Columbia | 8.9% |
| 16 | Delaware | 8.8% |
| 17 | Pennsylvania | 8.8% |
| 18 | Rhode Island | 8.6% |
| 19 | Louisiana | 8.5% |
| 20 | Hawaii | 8.5% |
|
Rank
|
Name
|
Share of commuters with >60 minute commute
|
|---|---|---|
| 21 | South Carolina | 7.8% |
| 22 | Mississippi | 7.7% |
| 23 | Tennessee | 7.7% |
| 24 | Wyoming | 7.4% |
| 25 | Arizona | 7.4% |
| 26 | Alabama | 7.2% |
| 27 | Maine | 7.2% |
| 28 | Colorado | 7.1% |
| 29 | New Mexico | 7.0% |
| 30 | North Carolina | 6.9% |
|
Rank
|
Name
|
Share of commuters with >60 minute commute
|
|---|---|---|
| 31 | Kentucky | 6.5% |
| 32 | Vermont | 6.4% |
| 33 | Indiana | 6.3% |
| 34 | Michigan | 6.1% |
| 35 | Oregon | 5.9% |
| 36 | Nevada | 5.9% |
| 37 | Missouri | 5.6% |
| 38 | Idaho | 5.6% |
| 39 | Arkansas | 5.6% |
| 40 | Utah | 5.5% |
|
Rank
|
Name
|
Share of commuters with >60 minute commute
|
|---|---|---|
| 41 | Ohio | 5.3% |
| 42 | Alaska | 5.2% |
| 43 | Oklahoma | 5.1% |
| 44 | Wisconsin | 5.1% |
| 45 | Montana | 5.0% |
| 46 | Minnesota | 4.9% |
| 47 | Iowa | 4.5% |
| 48 | South Dakota | 4.4% |
| 49 | North Dakota | 4.3% |
| 50 | Kansas | 4.0% |
|
Rank
|
Name
|
Share of commuters with >60 minute commute
|
|---|---|---|
| 51 | Nebraska | 4.0% |
New Jersey (15.2%) and Maryland (14.5%) follow New York, both shaped by commuter flows into major job centers like New York City and Washington, D.C.
Massachusetts (13.3%) and California (12.1%) round out the top five, reflecting congestion in large metro regions such as Greater Boston and the Bay Area/Los Angeles corridors.
Generally, commutes are longer in states with high population density because jobs are often concentrated in a handful of major urban cores, while housing spreads outward into suburbs and exurbs. As traffic increases and public transit systems strain, commute times rise.
However, density isn’t the only factor. Rhode Island is a useful counterexample: despite having the second-highest population density in the country, its small geographic footprint helps limit commute lengths, with only 8.6% of commuters traveling more than an hour.
At the low end of the ranking, Great Plains states such as Nebraska (4.0%), Kansas (4.0%), and North Dakota (4.3%) have the smallest shares of long commuters, reflecting smaller metro areas and lower congestion.


