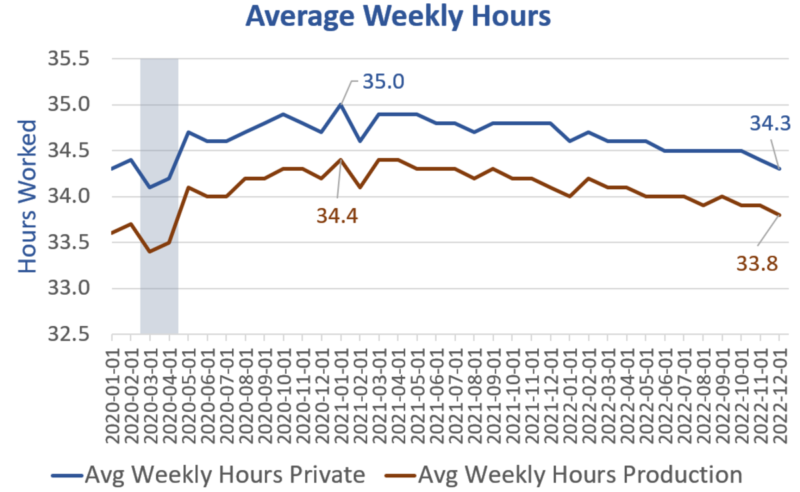
The blue line is the average hours worked for all private workers. The red line is average weekly hours of production and nonsupervisory workers.
This article was originally published by Mish Talk.
Index of Aggregate Hours
Chart Notes
- Once again the blue line is total private while red is production and nonsupervisory.
- These are index levels not total hours worked.
- Production, a subset of total private, does not have more hours worked.
Index of Aggregate Hours Definition
Indexes of aggregate weekly hours are calculated by dividing the current month’s aggregate hours by the average of the 12 monthly figures, for the base year. For basic industries, the hours aggregates are the product of average weekly hours and employment of workers to which the hours apply (all employees or production and nonsupervisory employees). At all higher levels of industry aggregation, hours aggregates are the sum of the component aggregates.
Both of the above series come from the establishment survey.
Household Survey vs. Payroll Survey
- The payroll survey (sometimes called the establishment survey) is the headline jobs number. It is based on employer reporting.
- The household survey is a phone survey conducted by the BLS. It measures employment, unemployment and other factors.
Calculating Total Hours Worked
Although the average work week is has declined steeply, total hours worked has been rising until recently. The numbers are all seasonally adjusted so we can can compare months.
I multiplied average hours by total nonfarm for one set of numbers and production hours by the number of production and supervisory workers for a second set of numbers.
October was the peak month for all private workers. September was the peak month for production and nonsupervisory workers.
Total Hours All Private
- October: 5,287,608,000 Hours
- December: 5,273,385,000 Hours
Total Hours Production and Nonsupervisory
- September: 3,620,966,000 Hours
- December: 3,613,490,000 Hours
I have not studied this data to know how noisy it is. Also, there could be significant rounding errors. However, all the charts and my calculations are in sync.
The indexes of aggregate hours appear to be rolling over and my calculation suggests the same.
Meanwhile, assuming you have faith in these payroll numbers the numbers of jobs keeps rising.
December Jobs: Employment Rises by 717,000 All of Them Part Time
For discussion of the latest jobs report, please see December Jobs: Employment Rises by 717,000 All of Them Part Time
Nonfarm jobs rose by 223,000 and employment jumped but huge divergences continue for the 9th month.
Payrolls vs Employment Since March 2022
- Nonfarm Payrolls: +2,887,000
- Employment Level: +916,000
- Full Time Employment: -288,000
Full time employment is down 288,000 since March and down by 444,000 since May!
Declining hours from the establishment survey fits in nicely with trends in the employment levels.
I strongly believe we will see major revisions to the downside in some of this data. It happens at every economic turn.


