This analysis focuses on gold and silver physical delivery on the Comex. See the article What is the Comex for more detail.
An article earlier this month reviewed the massive volume of physical metal leaving the bank House accounts over the last two years. December 2021 finished the year off with a massive drawdown in House account inventories. While the drawdown continues across most accounts, Bank of America has tried to recoup some of the physical that left their holdings in December. As the data below shows, this has led to an extremely strong January to kick-off 2022.
This article was originally published by Schiff Gold.
Silver: Recent Delivery Month
Silver is wrapping up January which is historically a low volume minor month after December. Furthermore, February is another minor month in silver which really leaves January on its own. That being said, the chart below shows extremely high delivery volume. With 49 contracts remaining of Open Interest, it could still make a push to challenge last June and even last April.
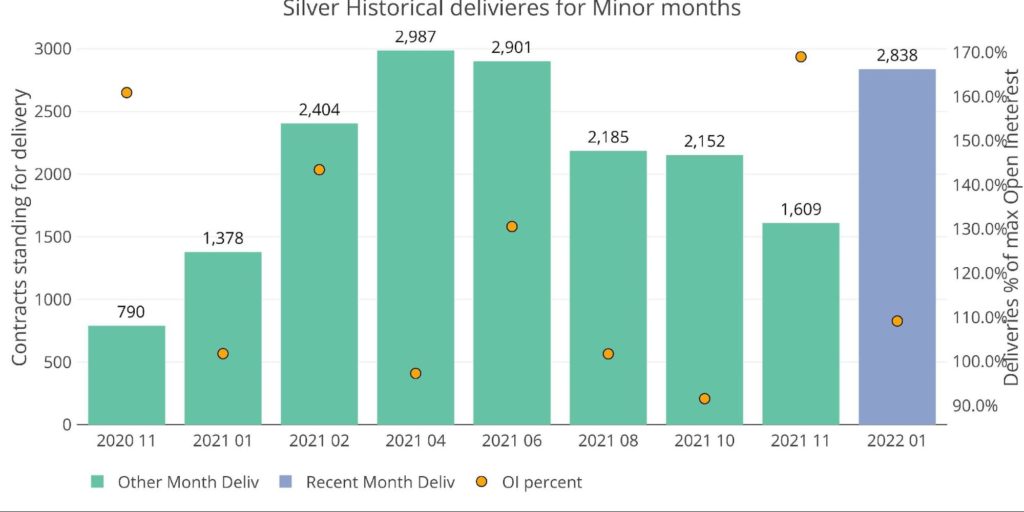
Figure: 1 Recent like-month delivery volume
The initial Comex results analysis showed January to be strong, but well short of the big months of April and June.
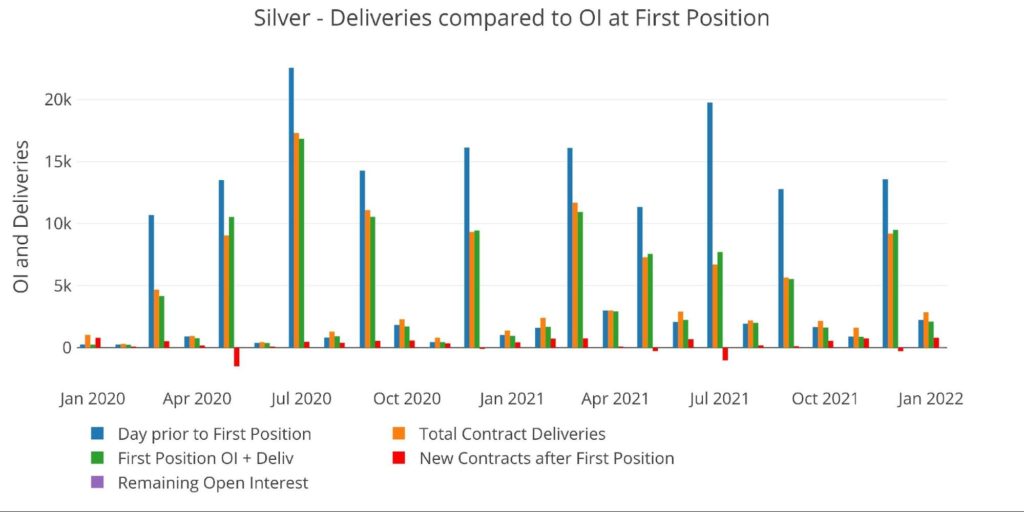
Figure: 2 24-month delivery and first notice
The green bars above represent the open interest on First Position which is typically a good predictor of the delivery volume for the month. This is when contracts need to post 100% cash. After First Position, contracts can still cash settle, or contracts can open and stand for immediate delivery (red bars above). This January saw a slight dip into First Position of 112 contracts and leaving 2,101 open. This is more than double the 949 last January.
Since then, 786 contracts have opened for immediate delivery (red bar above and red line below). As can be seen in Figure 3, this is a record for minor months going back to early 2020.
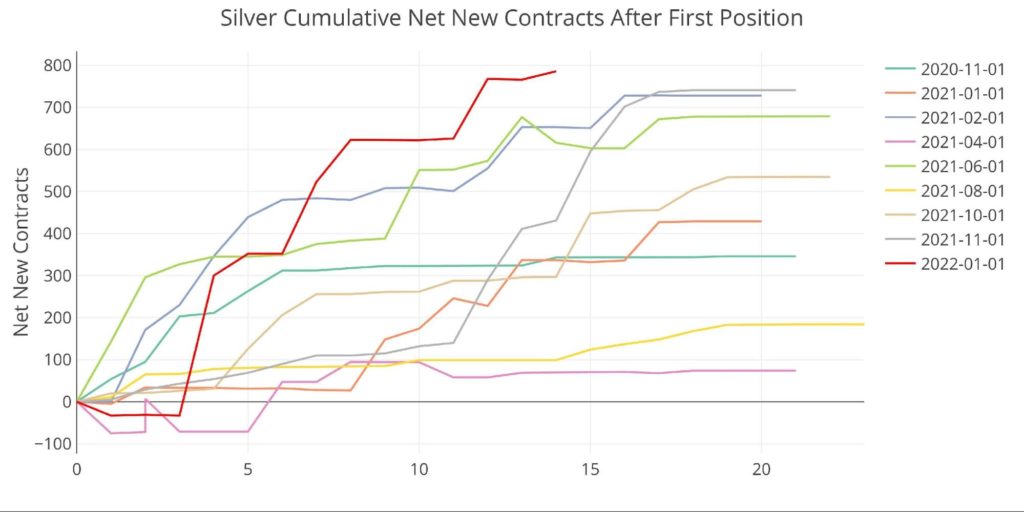
Figure: 3 Net New Contracts
Who or what is driving such strong activity? Bank of America. On First Position, Bank of America House Account took delivery on 821 contracts. Since then, they have taken delivery of another 1,030 contracts! This can be seen in the House account activity below that highlights the BofA delivery.
As shown, BofA spent most of 2021 stocking up on physical silver while the rest of the House accounts bled out. Then in December, BofA had 4,949 contracts (24.7M ounces) leave in one fell swoop. They have responded in late December and January by buying back more than half the amount lost (2,686).
There has been discussion online about Bank of America being short a ton of silver and trying to get out of the position. This article will not explore the topic beyond highlighting the strange behavior coming from BofA in recent months. As shown in the gold section below, the odd behavior exists in that market as well.
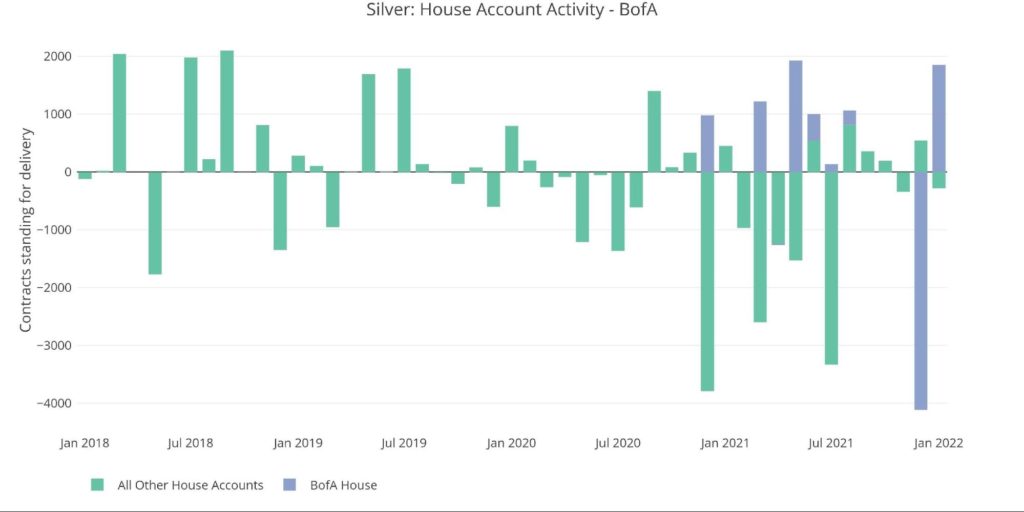
Figure: 4 House Account Activity
Coming back to January at large, from a historical perspective, this January crushed any previous January in nominal terms. This includes the period around 2011 when silver last approached $50. The chart below is in dollars delivered.
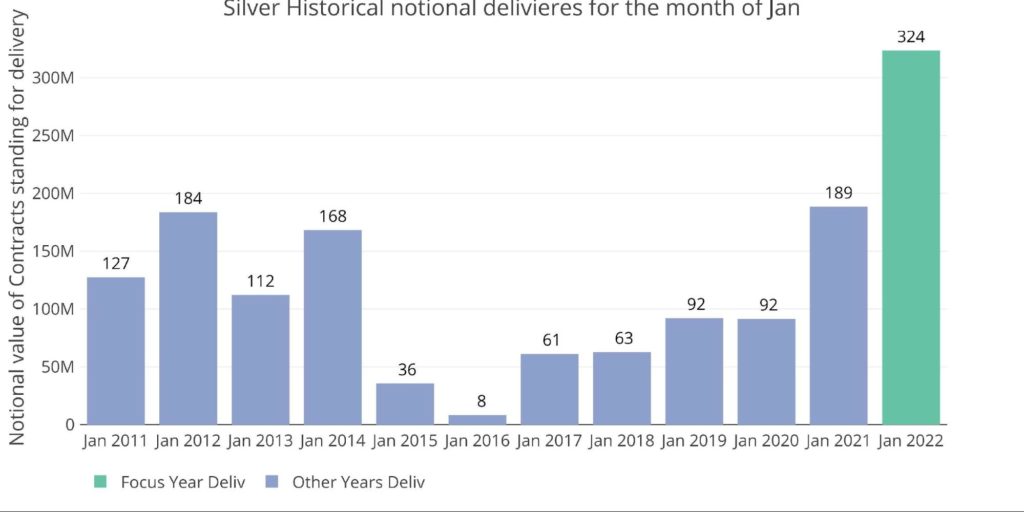
Figure: 5 Notional Deliveries
Silver: Next Delivery Month
As mentioned, February is another minor month in silver. So far, open interest is looking very weak. Compared to the last several months, silver is way below average. Remember, it was last February when the open interest first spiked into the close.
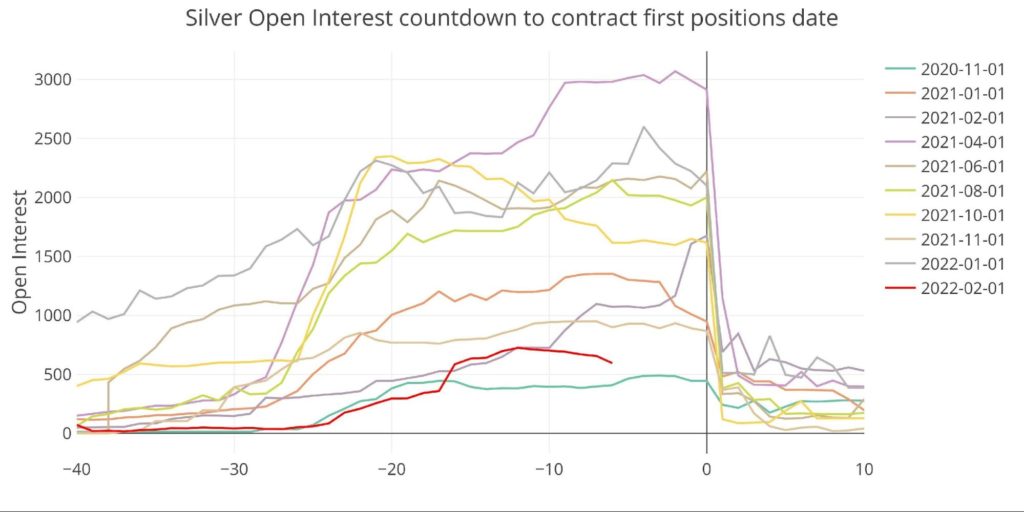
Figure: 6 Open Interest Countdown
It does not look like February will exceed the delivery volume in January. However, BofA is still down over 2,000 ounces after the December event so it cannot be ruled out entirely.
Gold: Recent Delivery Month
The charts below follow the same order as the silver charts above.
January gold has seen extremely strong delivery volume for a minor month. It has more than doubled November and is well above the high from September. Furthermore, the total delivered so far is more than 200% of the max open interest seen for the January contract. After the massive delivery in March last year, volume plummeted. Since then, it has been climbing back up month over month. Similar to silver though, the January activity can be attributable to BofA as shown below.
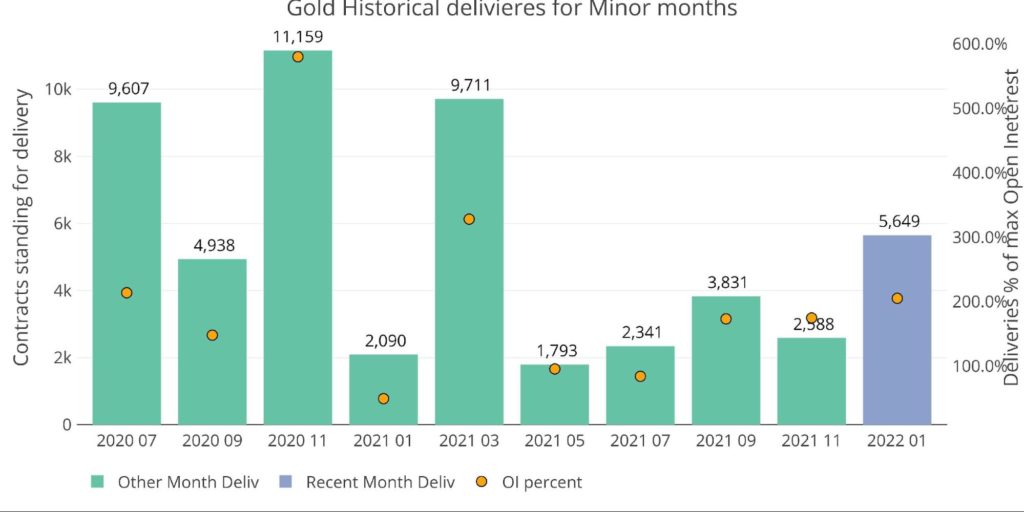
Figure: 7 Recent like-month delivery volume
First, the chart below shows how large the red and orange bars are relative to other minor months. It also puts the delivery volume into perspective against the major months.
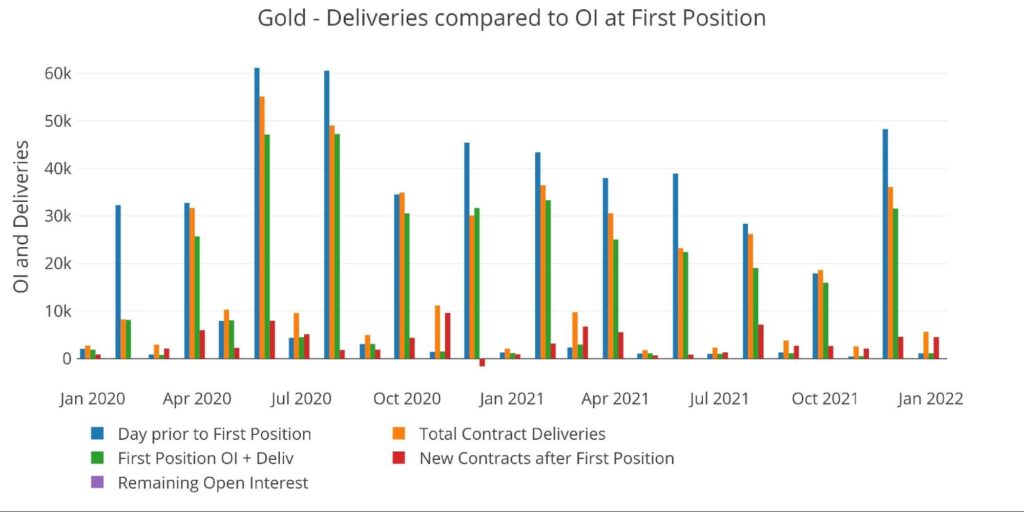
Figure: 8 24-month delivery and first notice
When looking at net new contracts, gold is only behind March of last year. It likely will also fall below November 2020 unless there is an unexpected big spike up as seen in that month.
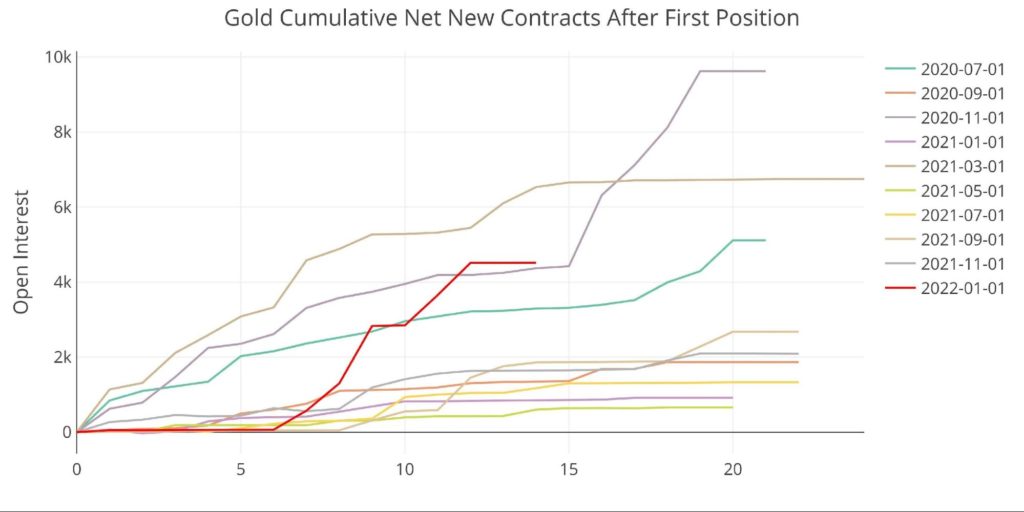
Figure: 9 Net New Contracts
Again, the mid-month activity is being driven almost entirely by Bank of America. The BofA House account took delivery of 666 contracts to start the month. Since then, they have stood for immediate delivery of 4,156 contracts bringing the total to 4,822 (almost $900M). This is more than half the 7,822 they lost in December.
However, December losses for BofA were only contained due to mid-month activity that month as well. At the start of the month, they had delivered out 11,701 contracts before buying back 3,977. Similar to silver, they had spent the better part of a year building up a physical position only to watch it evaporate in a single month. While they have bounced back in January, the rest of the street continues to bleed out.
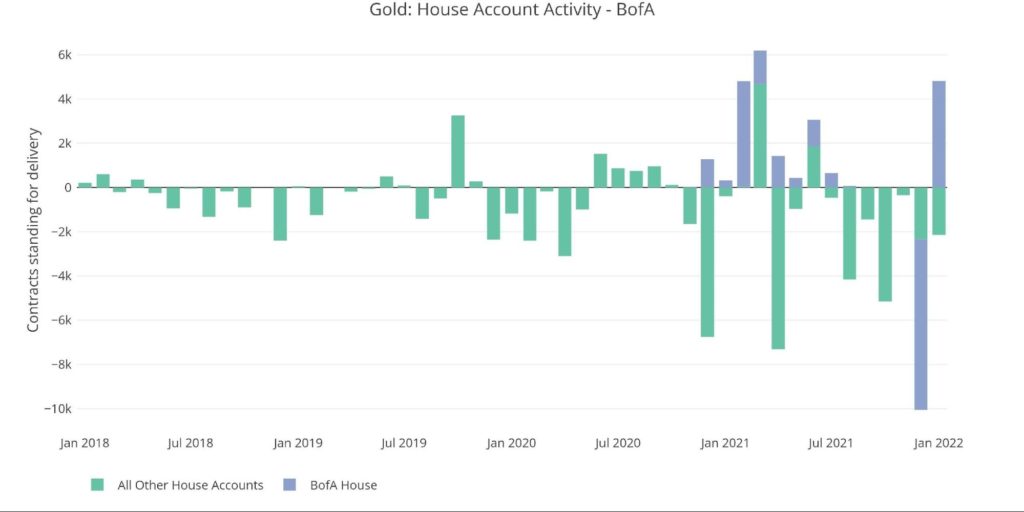
Figure: 10 House Account Activity
Looking at January historically shows that it has been the largest January on record by more than double with over $1B delivered!
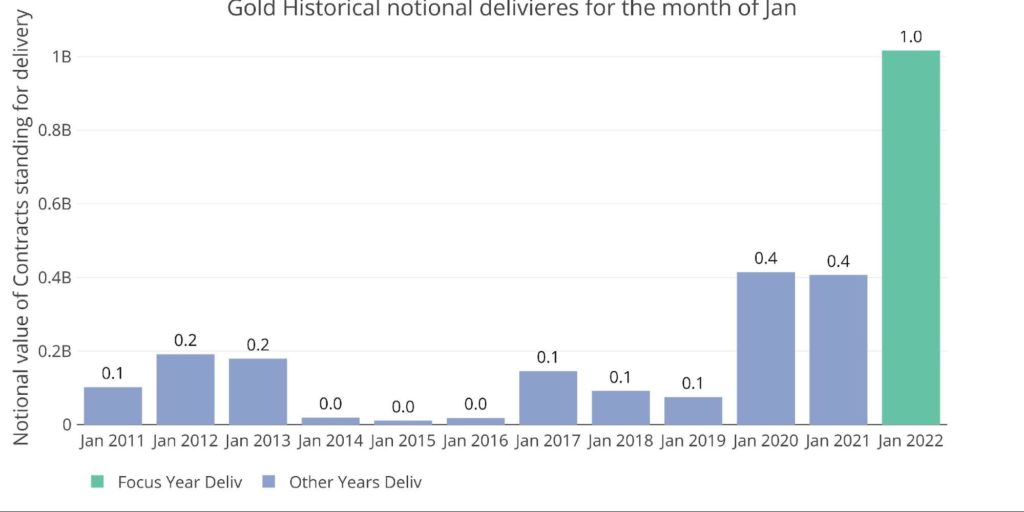
Figure: 11 Notional Deliveries
Gold: Next Delivery Month
February gold is trending down as is typically seen in major months. It’s too early to tell if February will prove to be another big month like December. An article will analyze the data on contract close in 6 business days.
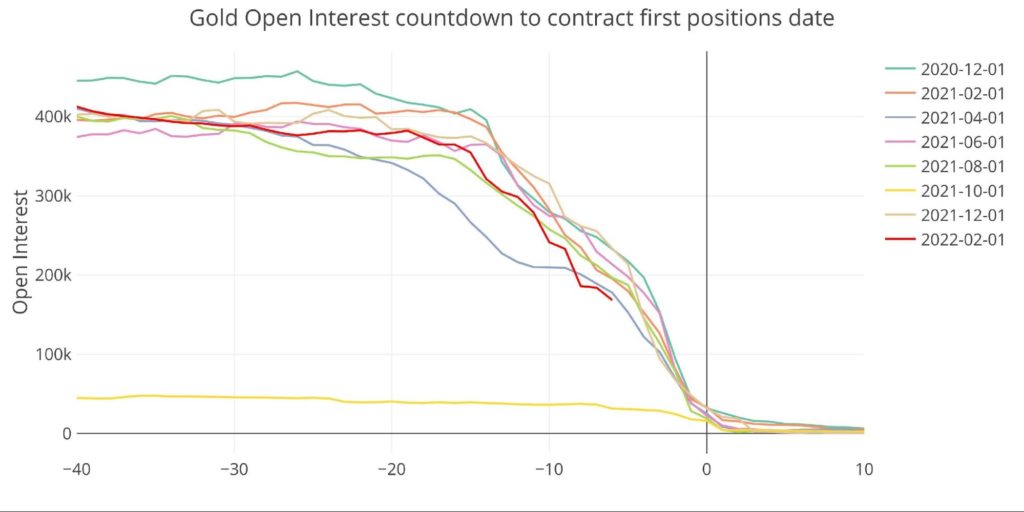
Figure: 12 Open Interest Countdown
As shown below, December bucked a downward trend in major months. Can February keep the momentum going?
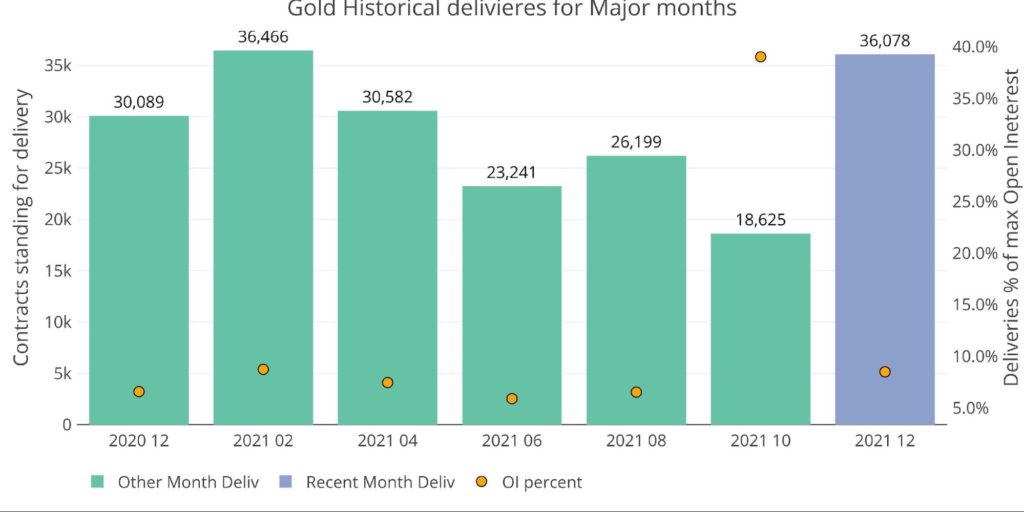
Figure: 13 Historical Deliveries
Cost to roll
The current cost to roll contracts is still relatively low as shown below. This will not prompt delivery on its own, so demand for physical would have to come organically.
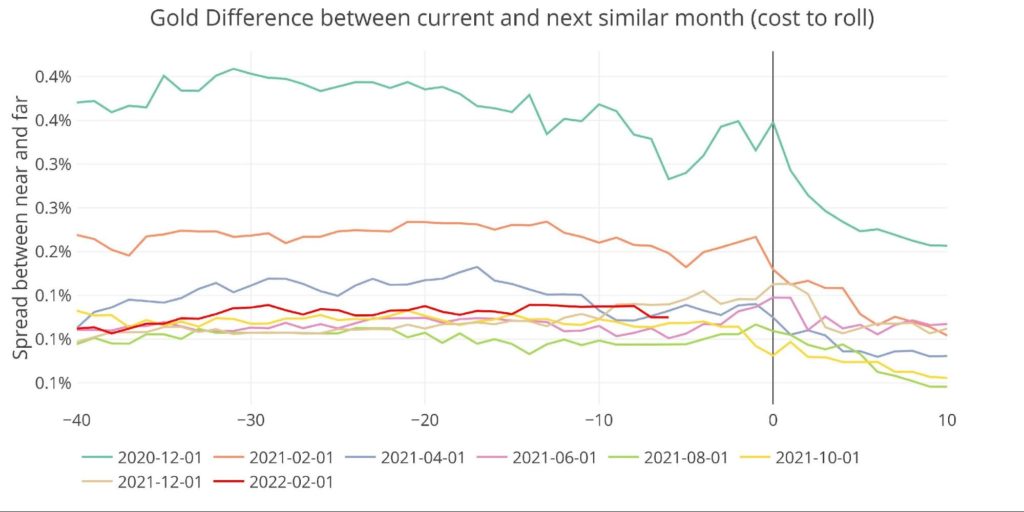
Figure: 14 Roll Cost
Wrapping up
January has been a major surprise to the upside, but most of that can be attributable to Bank of America. It seems strange that BofA would drop such a massive position in a single month only to buy it back immediately after. It’s impossible to speculate on the behavior with the data available. But it’s strange.
Is something brewing under the surface? Why do the other House accounts continue to drop physical positions? Is the BofA activity over the last several weeks driving the price of gold and silver up? They bought over 1600 ounces earlier this week as gold finally burst through $1833. Since then, they have slowed their purchases, potentially resulting in the pullback seen in gold the last two days.
Hard to know anything for sure, but the data does indicate more is going on behind the scenes in the physical market. Time will tell!
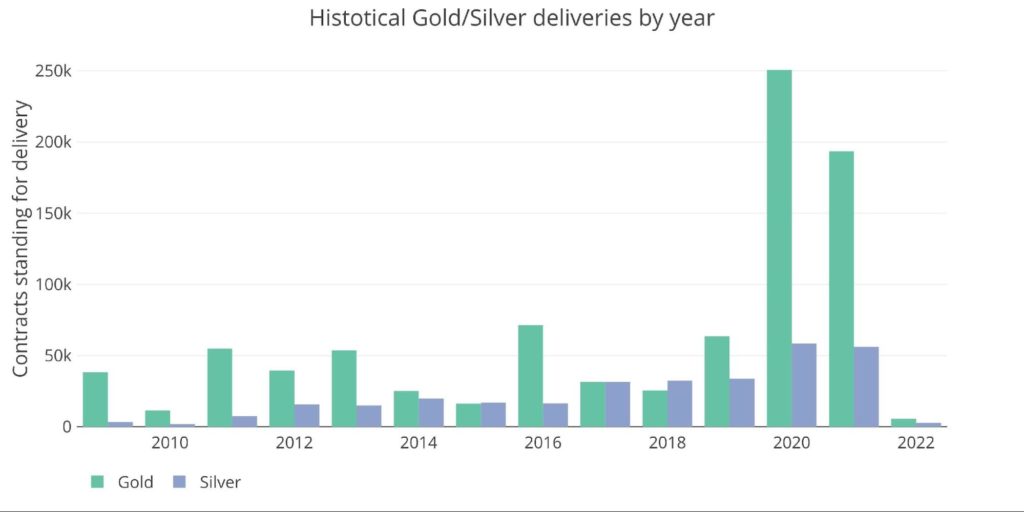
Figure: 15 Annual Deliveries
Data Source: https://www.cmegroup.com/