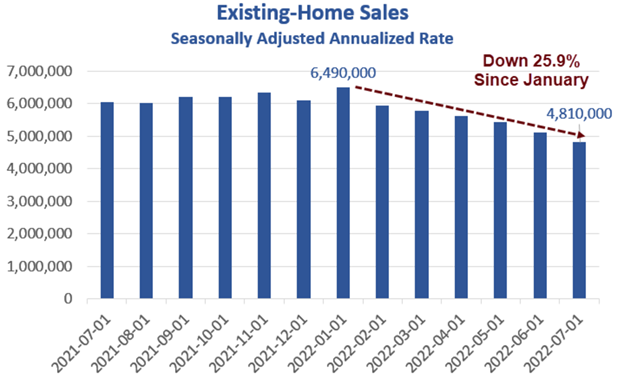
The housing slump accelerates with another 5.9 percent decline in July, down 20.2 percent from a year ago, and 25.9% since January.
This article was originally published by Mish Talk.
Housing Crash Continues
The National Association of REALTORS® reports Existing-Home Sales Retreated 5.9% in July.
Key Existing-Home Sales Points
- Existing-home sales fell for the sixth consecutive month to a seasonally adjusted annual rate of 4.81 million.
- Sales were down 5.9% from June and 20.2% from one year ago.
- The median existing-home sales price climbed 10.8% from one year ago to $403,800.
- The median price is down $10,000, however, from last month’s record high of $413,800.
- The inventory of unsold existing homes rose to 1.31 million by the end of July, or the equivalent of 3.3 months at the current monthly sales pace.
- The median existing-home price for all housing types in July was $403,800, up 10.8% from July 2021 ($364,600), as prices increased in all regions. This marks 125 consecutive months of year-over-year increases, the longest-running streak on record.
- Properties typically remained on the market for 14 days in July, the same as in June and down from 17 days in July 2021. The 14 days on market are the fewest since NAR began tracking it in May 2011. Eighty-two percent of homes sold in July 2022 were on the market for less than a month.
- First-time buyers were responsible for 29% of sales in July, down from 30% in June and also in July 2021.
- All-cash sales accounted for 24% of transactions in July, down from 25% in June, but up from 23% in July 2021.
- Individual investors or second-home buyers, who make up many cash sales, purchased 14% of homes in July, down from 16% in June and 15% in July 2021.
Existing Home Sales Month-Over-Month
Existing Home Sales Last 25 Years
Fed-Induced Panic Buying
The panic buying caused by free money stimulus and absurdly low rates thanks to the Fed will remain untouched until prices crash, mortgage rates come down or both.
With median prices rising a record 125 consecutive months of year-over-year, the decline in mortgage rates from over 6 percent in June to 5.48 percent today will not do much to spur sales.
Case-Shiller Home Price
Housing Affordability Index Drops to Lowest Rate Since 1989, Still Way Too High
For discussion of the above chart, please see Housing Affordability Index Drops to Lowest Rate Since 1989, Still Way Too High.
The Fed wanted to create inflation, and did, far more than it understands because it does not see the rise in housing prices as inflation.
Spotlight on Fed Silliness
The Fed has blown three consecutive bubbles trying to produce two percent consumer inflation while openly promoting raging bubbles in assets especially housing.
Payback has arrived. Expect very weak growth for years to come as the Fed struggles with inflation and the end of globalization.
Looking ahead, housing rates to be miserable and durable goods (appliances, furniture, cabinets, etc.) miserable along with housing.
By the way, when is the last time existing home sales collapsed 25.9 percent in six months with the economy not in recession?
For discussion, please see A Third Quarter of Negative GDP is Now Highly Likely.


