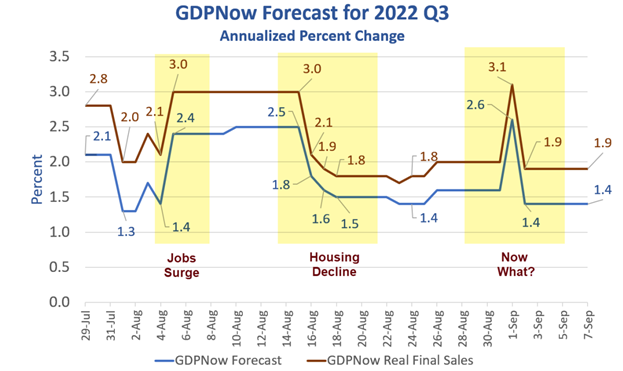
The GDPNow forecast has certainly been interesting this quarter. We had a second big surge on September 1 that immediately vanished the next day but only posted as of today.
This article was originally published by Mish Talk.
Catching Up
In my previous GDPNow Update on August 24, I commented “Even if you believe in a big economic boost from the July jobs report, housing erased those gains and more for the GDPNow Real Final Sales estimate.”
On September 1, the GDPNow model may a big leap on ISM and construction spending, but I am not sure which one of those triggered the jump.
I don’t believe the ISM numbers and construction is going to hell. So, rather than comment “I don’t believe this“, I waited for the next set of numbers, out today.
Please consider the September 7 update to the GDPNow Forecast for Q3 GDP.
The GDPNow model estimate for real GDP growth (seasonally adjusted annual rate) in the third quarter of 2022 is 1.4 percent on September 7, down from 2.6 percent on September 1. After recent releases from the US Census Bureau, the US Bureau of Labor Statistics, the US Bureau of Economic Analysis, and the Institute for Supply Management, the nowcasts of third-quarter real personal consumption expenditures growth, third-quarter real gross private domestic investment growth, and third-quarter real government spending growth decreased from 3.1 percent, -3.5 percent, and 1.7 percent, respectively, to 1.7 percent, -5.8 percent, and 1.3 percent, respectively, while the nowcast of the contribution of the change in real net exports to third-quarter real GDP growth increased from 0.82 percentage points to 1.09 percentage points.
What Happened On September 2?
The Jobs Report Much Is Weaker Than It Looks For Six Months
Either ISM or construction spending (or both) triggered the surge. But we do know what triggered the decline, the BLS jobs report.
On September 2, I commented The Jobs Report Much Is Weaker Than It Looks For Six Months
In a follow up report I commented Increasingly Likely That Alleged Job Strength is a Mirage of Part Time Second Jobs
The economy added 1,888,000 jobs while full time employment declined by 383,000 and total employment (as measured by sum of full and part time) was down by 48,000.
The total discrepancy between the trends is 1,888,000 + 48,000 = 1,936,000
It appears the GDPNow model picked up on that, or the decline in work hours, or other weaknesses in the BLS report.
It’s not just the headline number the model looks at, but something (or a number of thing) in the report were weaker than expected by the model.
RFS ignores changes in inventories which net to zero over time. This is a good reason to ignore the talk of two quarters of declining GDP being a recession.
RFS in the second quarter was positive. I stick with my assessment of a recession starting in May, assuming the upcoming data matches my forecasts.
Retail sales plunged in May after a strong April, and that’s when housing started to crumble as well.
1.9 percent on real final sales is not recession territory, but I strongly believe that will not hold up. GDPNow forecasts tend to start out strong then fade as the quarter progresses.
There is still two months of data for Q3 coming up. Retail sales and housing rate to be weak. But will they be weaker than the model expects?
My guess is yes.
ISM Says Service Sectors Strengthens, the S&P Says Sharpest Contraction Since 2020
The GDPNow model looks at ISM, not the similar S&P PMI. The divergence is stunning.
On September 6, I commented ISM Says Service Sectors Strengthens, the S&P Says Sharpest Contraction Since 2020
Whereas ISM says the economy expanded at a faster pace, the S&P PMI is reporting a sharp contraction.
The GDPNow model often swings wildly on ISM estimates, and many of the reports are more than a bit suspect.
One criticism I have heard over the years is that ISM has severe survivor bias. That means weak companies go out of business or do not report results reliably.
A second idea tossed around is the S&P PMI incorporates more small-to-midsize businesses.
Whatever the explanation, I suggest to Pat Higgins to add the S&P PMI to the model to temper the wild swings and biases of the ISM.


