Jeremy Grantham recently made headlines with his latest market outlook titled “Let The Wild Rumpus Begin.” The crux of the article gets summed up in the following paragraph.
“All 2-sigma equity bubbles in developed countries have broken back to trend. But before they did, a handful went on to become superbubbles of 3-sigma or greater: in the U.S. in 1929 and 2000 and in Japan in 1989. There were also superbubbles in housing in the U.S. in 2006 and Japan in 1989. All five of these superbubbles corrected all the way back to trend with much greater and longer pain than average.
Today in the U.S. we are in the fourth superbubble of the last hundred years.”
This article was written by Lance Roberts and originally published by Real Investment Advice.
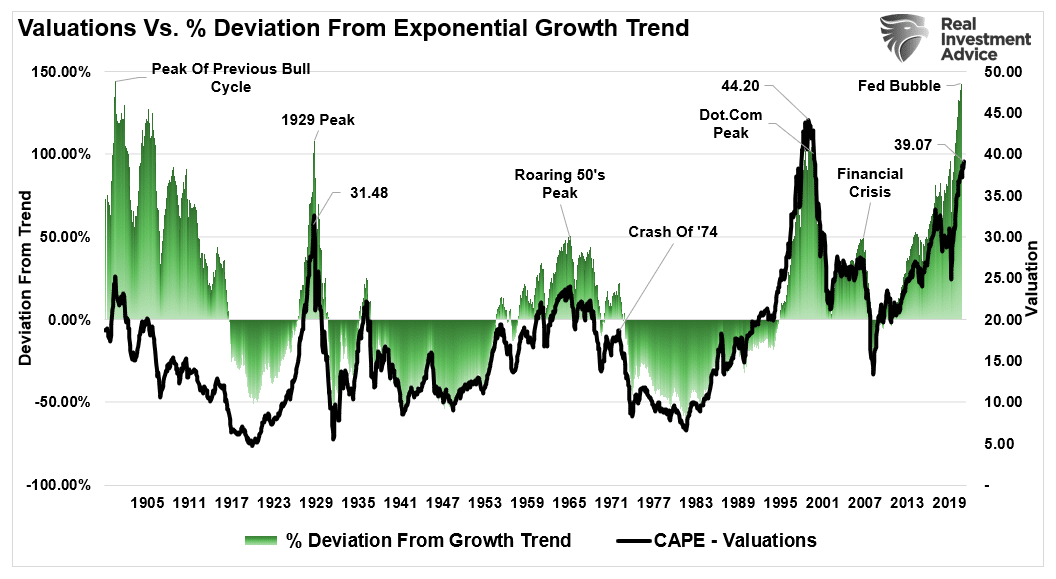
The bubble is easy to spot in the chart below of deviations of the market from its long-term exponential growth trend.
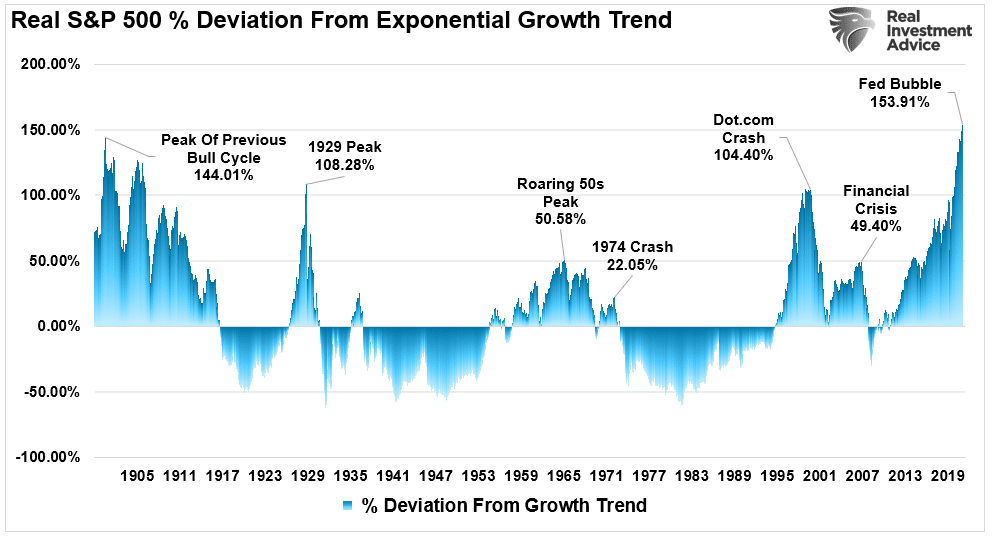
As Grantham correctly notes, investors don’t want to admit that a correction of magnitude is possible. However, the possibility of a 40-50% contraction to revert the massive extension from the long-term growth trend is highly probable. All that is needed is a catalyst, which so far has yet to appear.
Could the Fed be the catalyst? Maybe.
The problem is that crashes start slowly and then all at once. Only in hindsight does the catalyst become obvious.
What Makes A Bubble?
According to Investopedia:
“A bubble is a market cycle that is characterized by the rapid escalation of market value, particularly in the price of assets. Typically, what creates a bubble is a surge in asset prices driven by exuberant market behavior. During a bubble, assets typically trade at a price that greatly exceeds the asset’s intrinsic value. Rather, the price does not align with the fundamentals of the asset.“
This definition is suitable for our discussion. There are three components of a “bubble.” The first two, price and valuation, get dismissed or rationalized during the inflation phase. That rationalization is due to investor psychology and the “Fear Of Missing Out (F.O.M.O.)
Jeremy Grantham previously posted the following chart of 40-years of market bubbles. During the inflation phase, each got rationalized that “this time is different.”

However, we are most interested in the third component of bubbles: investor psychology.
Charles Kindleberger noted that speculative manias typically commence with a “displacement” that excites speculative interest. Then, the speculation becomes reinforced by a “positive feedback” loop from rising prices.
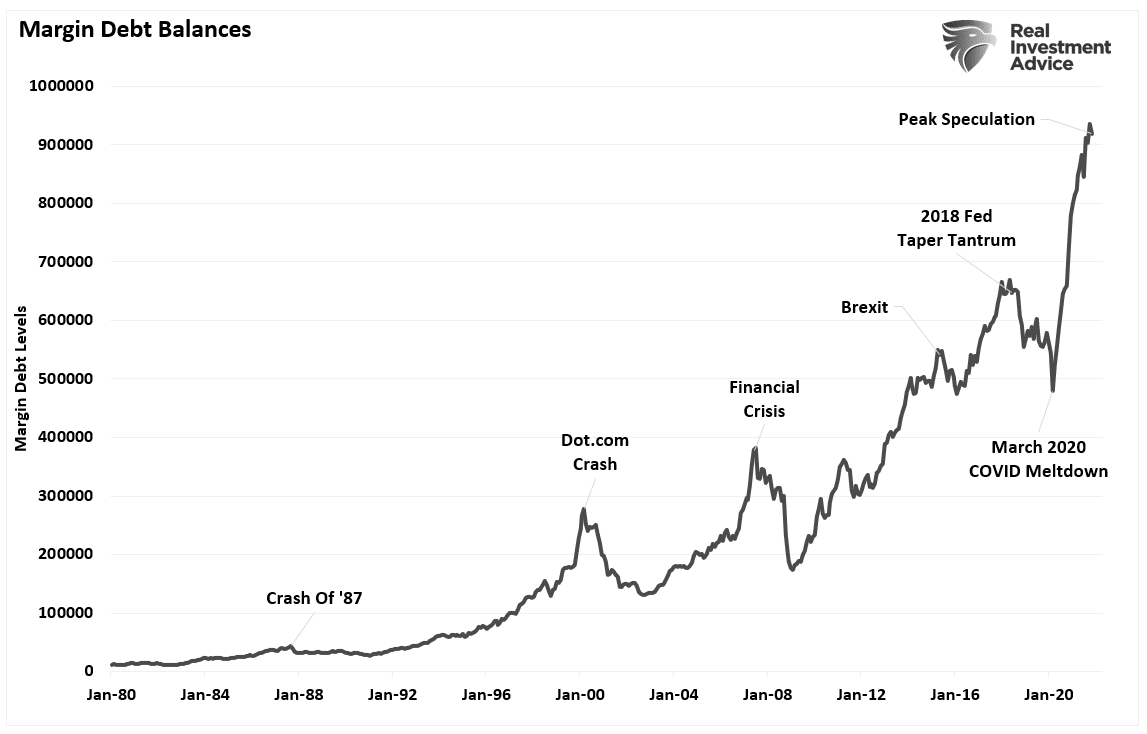
Such ultimately induces “inexperienced investors” to enter the market. As the positive feedback loop continues and the “euphoria” increases, retail investors then begin to “leverage” their risk in the market as “rationality” weakens. A look at margin debt suggests investors have leveraged their risk in the market.
A 40-50% Correction
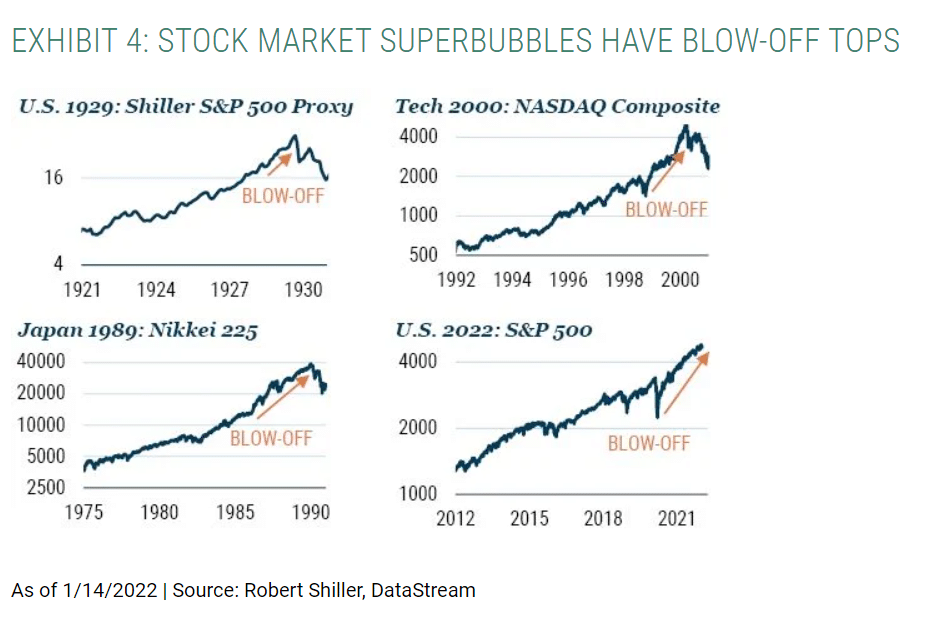
Grantham believes that exuberant investor psychology leads to a “blow-off” phase in financial markets. To wit:
“The penultimate phase of major bubbles is characterized by a “blow-off” which is an accelerating rate of stock price growth to two or three times the average of the preceding bull market. This pattern shows as clearly as any of history’s other great superbubbles in 2020 (see Exhibit 4).”
With that understanding, is it possible for the market to sustain a 40-50% retracement in a “mean reverting event?” That answer is “yes.” A logical retracement to previous long-term trendlines, as shown below, would be well within the context of a typical mean-reverting event. Those levels would be roughly 3800, retracing to the accelerated trendline from the 2009 lows. From recent highs, such would encompass approximately a 21% decline.
However, a correction to the long-term trendline from the 2009 lows would be a 41% crash.

Fibonacci Retracements
Another way to view a corrections potential is Fibonacci retracement levels. Here is a brief description:
“The Fibonacci retracement plots percentage retracement lines based upon the mathematical relationship within the Fibonacci sequence. These retracement levels provide support and resistance levels helpful in identifying target price objectives.
Fibonacci Retracements get displayed by first drawing a trend line between two extreme points. Next, a series of six horizontal lines intersect the trend line at the Fibonacci levels of 0.0%, 23.6%, 38.2%, 50%, 61.8%, and 100%.”
Using the beginning of the bull market rally in 2009, we can view the potential Fibonacci retracement levels.
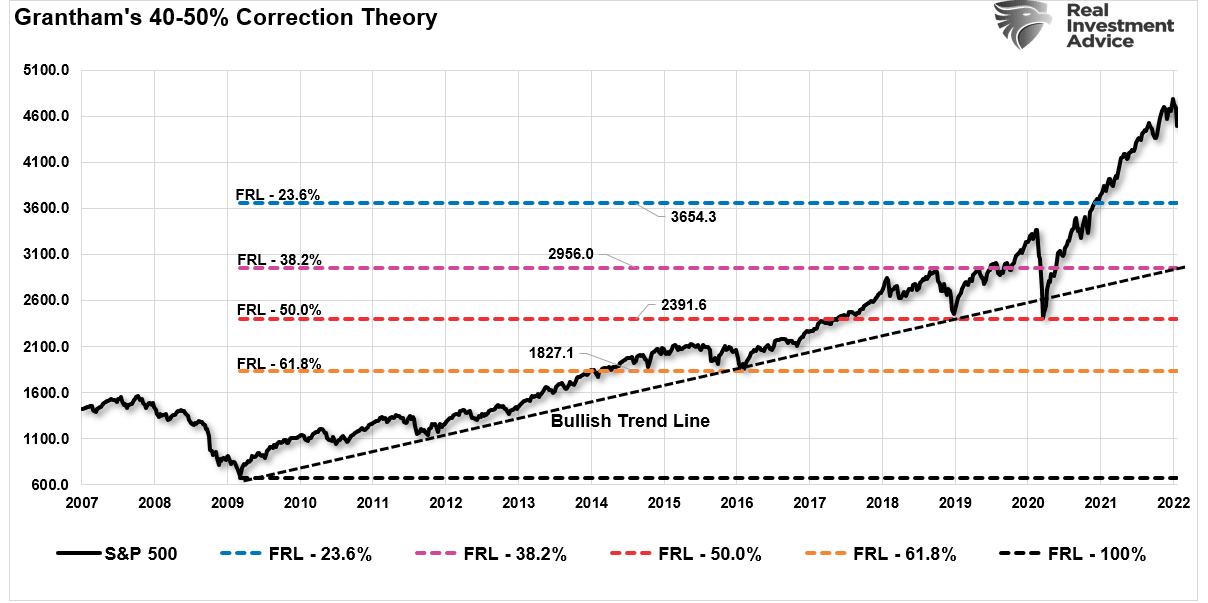
The two most important levels for market watchers, given Grantham’s view of a “mean reverting event,” are the 38.2% and 50% retracement levels. The 38.2% level intersects the running support trendline from 2009. The 50% retracement level aligns with the lows from 2018 and March 2020.
Should those two support levels fail, the market will likely search for a bottom at the 61.8% retracement level at the 2015-2016 lows.
That can’t happen, you say? Maybe.
But if previous “bubble history” serves as a guide, it is indeed a possibility worth considering. For example, the chart below shows the deviation of the market from the exponential growth trend overlaid with valuations and previous crisis events.
The Fed Put
“In the meantime, we are in what I think of as the vampire phase of the bull market, where you throw everything you have at it: you stab it with Covid, you shoot it with the end of QE and the promise of higher rates, and you poison it with unexpected inflation – which has always killed P/E ratios before, but quite uniquely, not this time yet – and still the creature flies. Until, just as you’re beginning to think the thing is completely immortal, it finally, and perhaps a little anticlimactically, keels over and dies.” – Jeremy Grantham
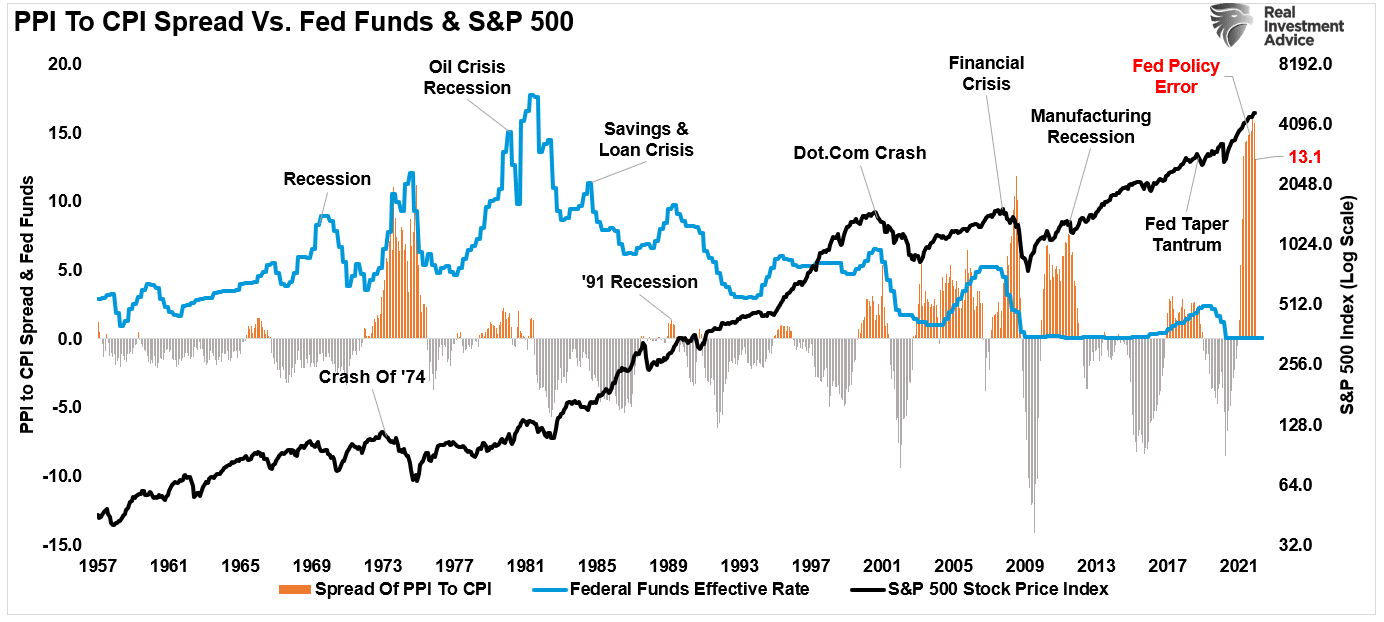
The one consideration, of course, is where does the Federal Reserve rush back to the rescue of the market. In 2018, it only took a 20% decline to see them quickly reverse course in tapering. In March 2020, the market collapsed 35% before the Fed could organize enough to intervene.
The difference in both cases, as stated previously, is the Fed did not have 7% inflation to deal with.
If the Fed raises rates to break the inflation surge, such also retards economic growth. Higher rates historically equate to more negative market outcomes. Such is particularly true when valuations become elevated and low rates support the bullish thesis.
The most significant risk to investors is the Fed’s ability to “jawbone” the markets to maintain financial stability when reversing monetary accommodation. Such is the same environment we saw in 2018 where the Fed uttered the words “we are nowhere close to the neutral rate.”
Two months later, and 20% lower in the markets, Jerome Powell discovered he had magically reached the “neutral rate” and needed to ease off on monetary tightening.
The biggest problem for the Fed is choosing between combating inflation or bailing out the markets.
Conclusion
Given the importance of “financial stability“ to the Federal Reverse, I suspect they will abandon their inflation mandate to support the financial system.
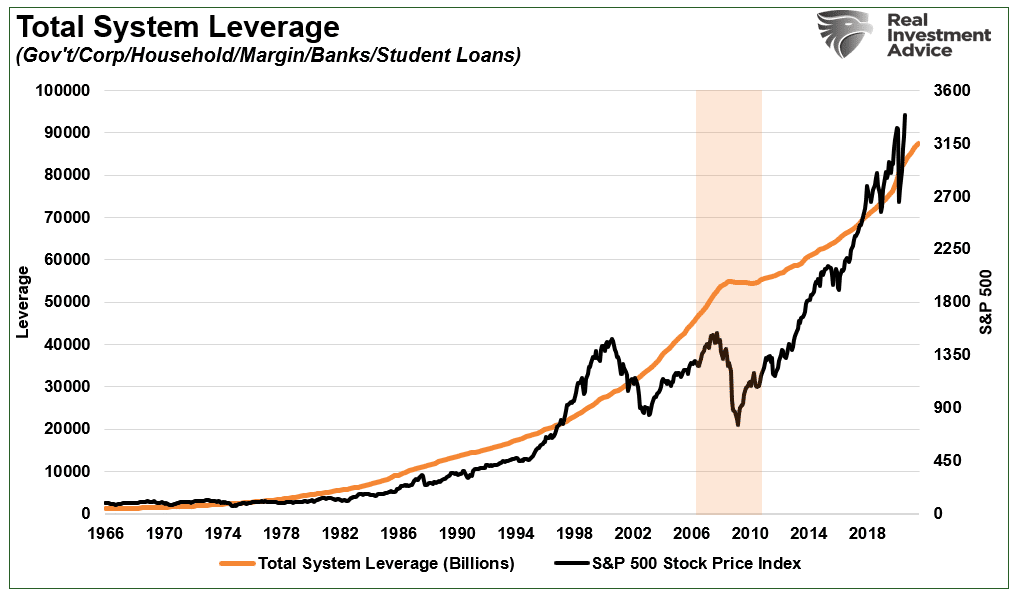
However, given the extreme buildup of debt and leverage in the financial system, a correction can quickly get out of their control. The resulting damage to the credit, financial, real estate, and labor markets will send economic growth plummeting too quickly for them to bail out.
Such is just my assumption, but when you look at the total amount of financial leverage in the system, you can understand why the risk is prevalent.
Whether you agree a bubble exists is largely irrelevant. Every investor approaches investing differently.
However, there are certainly a few points to consider, especially if you are nearing or in retirement. While Grantham’s view of a bubble is undoubtedly well documented with historical precedents, such doesn’t mean a crash happens immediately. Mean reverting events always occur slowly and then all at once.
Therefore, it is essential to understand that you can take action to mitigate the risk of such a crash.
- Avoid “herd mentality” – Just because everyone else is doing it, doesn’t mean its right.
- Do your own research and avoid “confirmation bias.”
- Develop a sound investment strategy including “risk management” protocals.
- Diversify your portfolio allocation to include “safer assets.”
- Control your “greed” and resist the temptation to “get rich quick.”
- Resist getting “anchoring” to a past values. Such leads to emotional mistakes.
- Remember that the larger the deviation from the mean, the greater the reversion will be. Invest accordingly.
Is Grantham’s view possible? Yes. Will it happen with certainty? No one knows.
However, if a mean reversion comes, the media will tell you, “no one could have seen it coming.”
Of course, hindsight isn’t very useful in protecting your capital.