The Commitment of Traders analysis last month showed a potentially bullish setup in both gold and silver. The washout of Managed Money Net Long contracts that occurred in early August appeared to be over and a rebound was underway. Unfortunately, it looks like there was another washout in September. As highlighted recently, it’s possible exhaustion may be near. However, if another washout occurs, it would probably drive Managed Money net positioning negative for the first time since Nov 2018.
This article was originally published by Schiff Gold.
Below is a look at the details.
Gold
Current Trends
Managed Money dropped to 30,861 in net long open interest. This is down from 46,844 in the previous week and from 81,677 on Aug 31. This week fell below the Aug 10th low of 35,403 but stayed just a touch above the Mar 9th low of 29,430. The price of gold followed the action, dropping from 1,815 on Aug 31 to 1,735 this past Tuesday before rebounding.
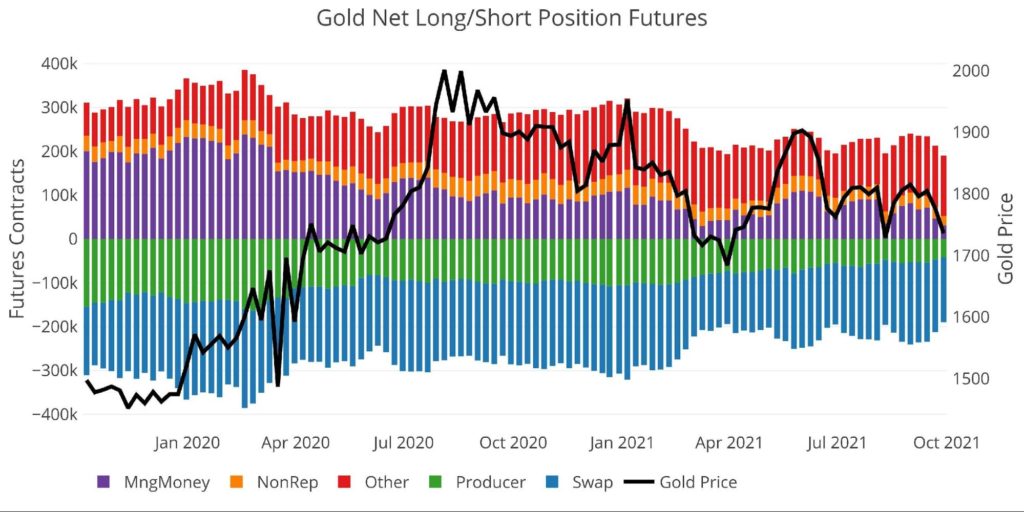
Figure: 1 Net Notional Position
On a positive note, the gold price actually held up rather well in the face of all the selling pressure. In fact, it closed the week above 1,760 which probably means the Managed Money net longs have reversed and started moving back up. The report next week will most likely show this turnaround.
As the weekly period-over-period chart below shows, it’s rare to see a one-week trend. Therefore, it’s probable Managed Money could continue adding to net longs, pushing the gold price up further and potentially challenging 1,800 an ounce again (strong resistance). That being said, the job numbers on Friday will probably drive the action.
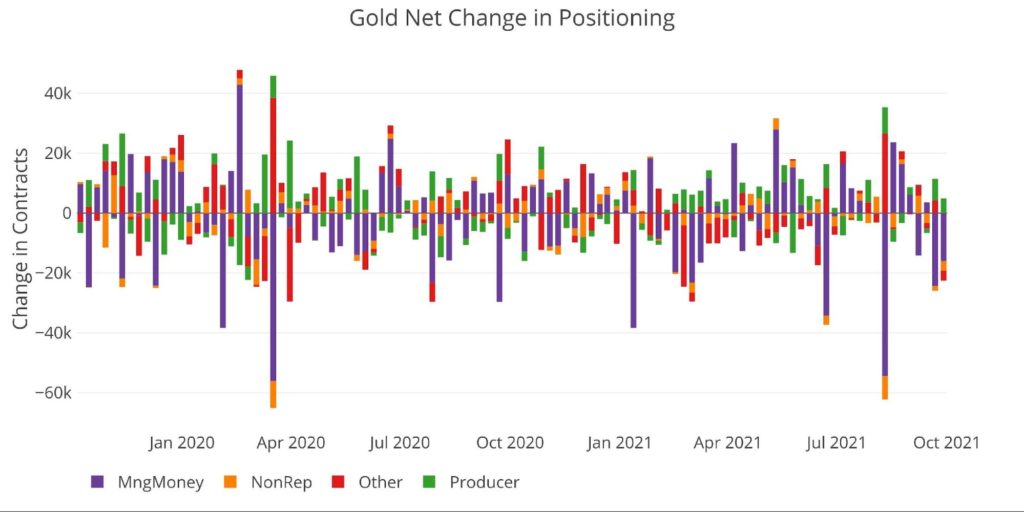
Figure: 2 Silver 50/200 DMA
The table below holds interesting data points. A few things to highlight:
- The Managed Money net long decrease was more a result of shorts being added
- Shorts increased 60% from 55k to 88k
- Longs only decreased 13% from 136k to 119k
- In total, net longs decreased by 62% over the one month period
- The rest of the longs held mostly steady except for Producers which increased by 36%
- Per usual, the swaps were on the opposite side of Managed Money, decreasing short positions by 40k contracts in September (15% from 260k to 220k)
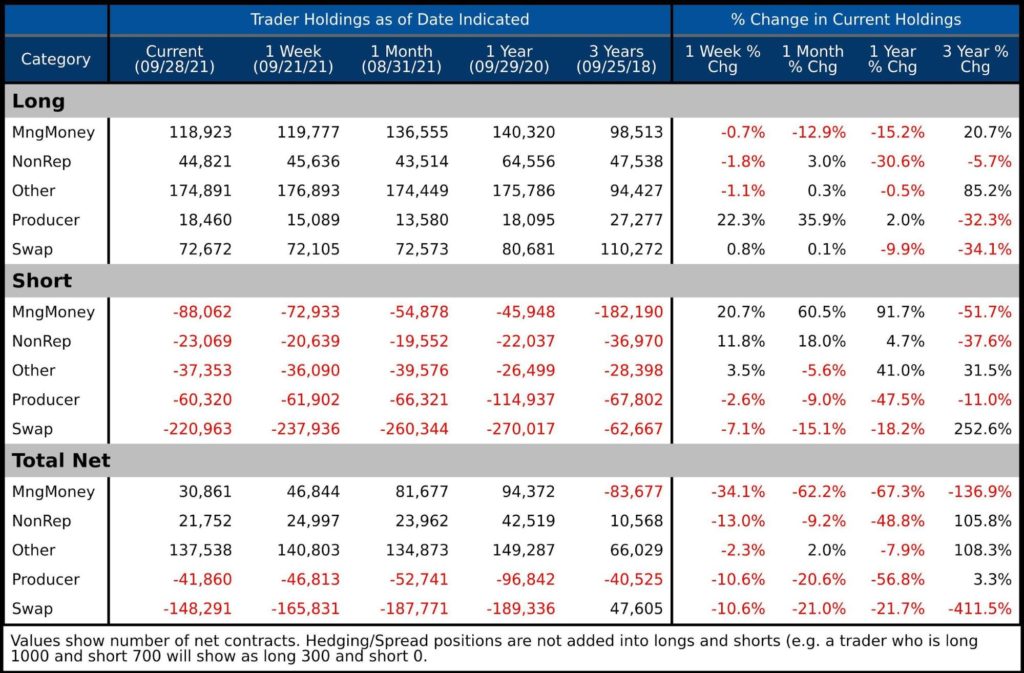
Figure: 3 Gold Summary Table
Historical Perspective
Looking over the full history of the COTs data by month produces the chart below (please note values are in dollar/notional amounts, not contracts). The chart shows the last run-up in price in 2011, followed by the slow fall into 2015 until the new bull market started in 2016. The response to the Trump election (gold sold off hard) can be seen clearly in the sharp drop-off in late 2016.
This chart also shows how big the “Other” category has become on the long side. In 2011, Other Long had 8.6B in gross long vs 30.3B in the most recent period.
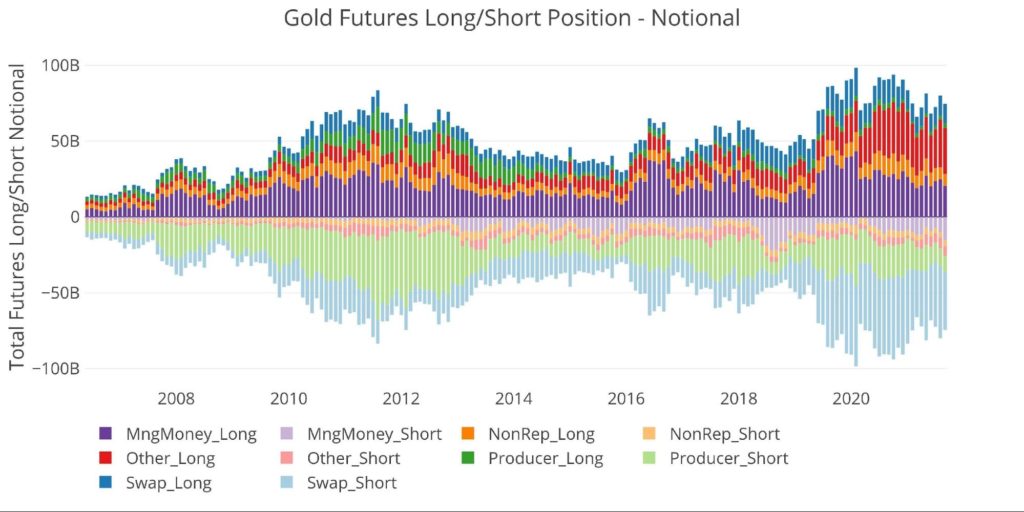
Figure: 4 Gross Open Interest
The CFTC also provides Options data. This has mainly been dominated by Producers, but recently Managed Money has played a larger role within the market. The current period shows a similar trend with Managed Money decreasing from $3.2B to $1.95B during September.
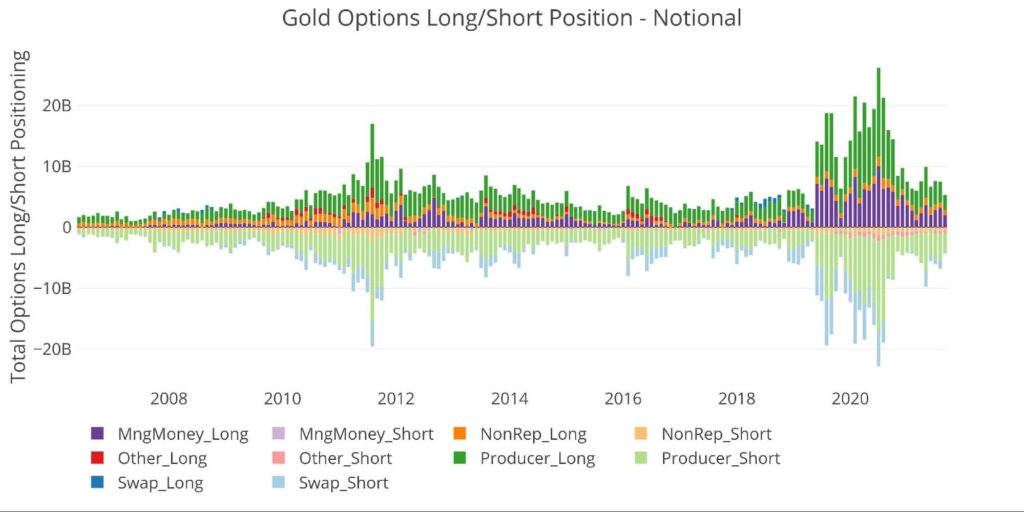
Figure: 5 Options Positions
Finally, looking at historical net positioning shows the correlation of Managed Money positioning with price. The peaks and valleys in price are mirrored in the open interest. The correlation did strongly diverge last year after the March 2020 sell-off. Hedge Funds continued reducing net long positions even while the price rose dramatically. This was probably due to strong ETF buying.
Note: The correlation will look stronger because price is half of the Notional value equation
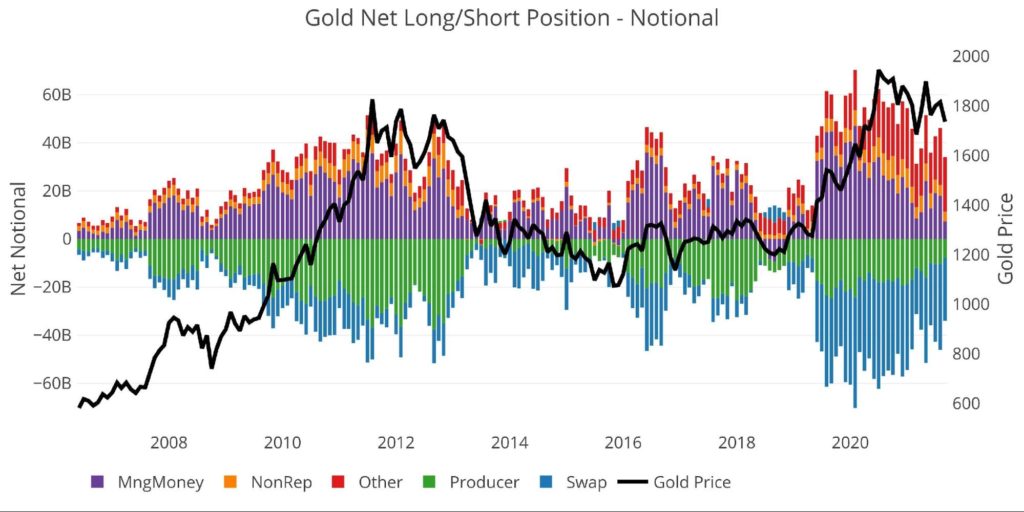
Figure: 6 Net Notional Position
Silver
Current Trends
Silver has been absolutely pummeled by Hedge Fund selling. The chart below has been expanded to 48 months. As shown, current long positioning by Managed Money is the lowest it has been since June 2019 when silver was $15 an ounce. Again, it is impressive the price has held up so well despite heavy selling from Managed Money.
Last year in the massive sell-off, silver was under $13 even when net longs stood at 10,467 contracts. More than double the 3,524 contracts in the most recent week and 8x where last week finished at 1,310 net long contracts. Still, the correlation of the black line and purple bars is impossible to ignore in the chart below.
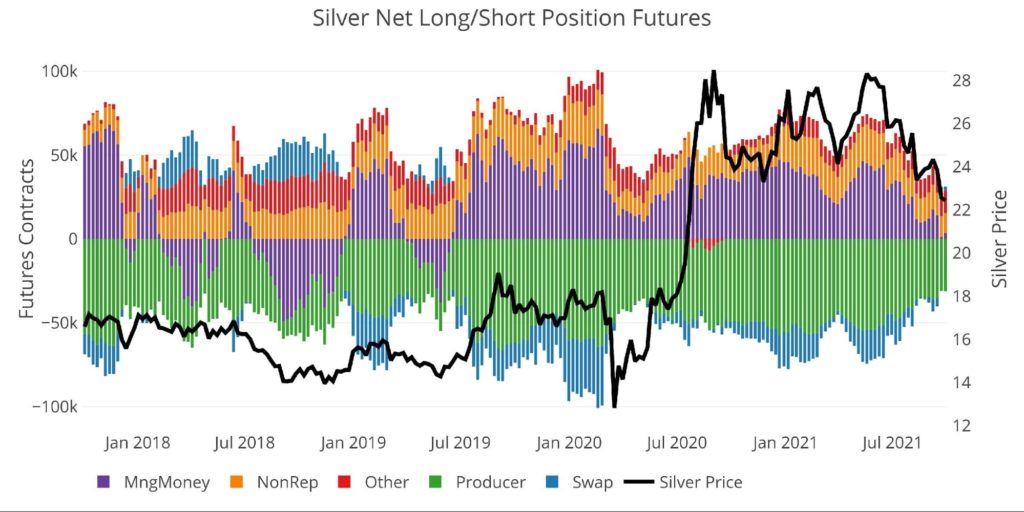
Figure: 7 Net Notional Position
The weekly chart shows the reversal that occurred this week. As mentioned above, this tends to move in trends, which would indicate further long positioned in the coming week (this most likely already happened given the price action Wed – Fri). If exhaustion is not near, then net positioning by Hedge Funds will surely go negative for the first time since June 11, 2019.
Keep in mind, that was before Covid, before QE infinity, before $4T being added to the balance sheet, and before exploding budget deficits. To think Hedge Funds would be net short in the current environment seems unfathomable and yet that was almost the case last week.
Everyone is front running the taper trade, expecting a repeat of the 2011-2015 market environment. Precious metals were crushed during this time all the way up until the Fed actually started hiking interest rates. It’s certainly possible PMs stay under pressure until the rumor becomes fact, but at some point, the smart money will start front running the trade that the Fed cannot possibly remove the monetary stimulus without crushing the stock market and economy.
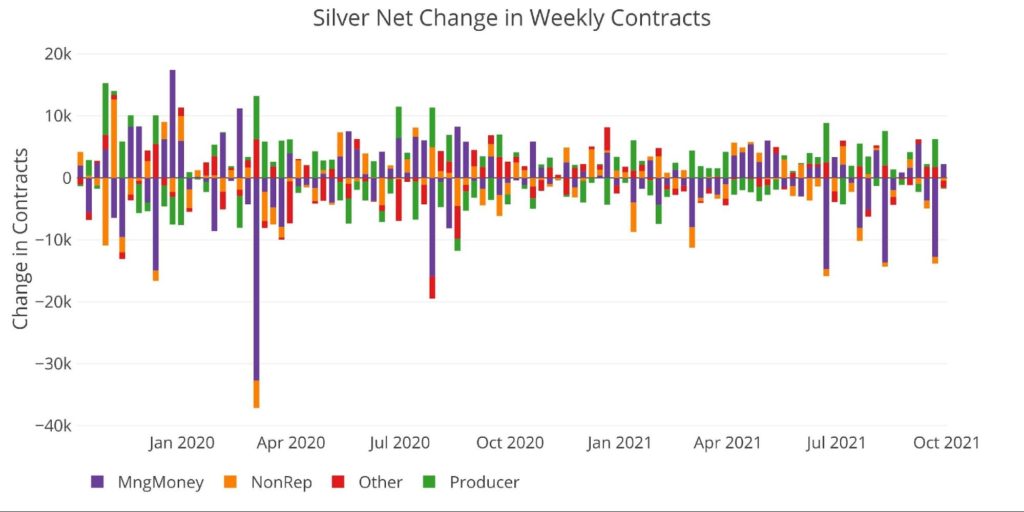
Figure: 8 Net Change in Positioning
The table below shows a series of snapshots in time. This data does NOT include options or hedging positions. Important data points to note:
- Similar to gold, increased short positions are more to blame than reduced long positions
- Longs fell 3.2% from 49k to 47.4k
- Shorts increased almost 20% from 36.7k to 43.9k
- In the most recent week, shorts and longs were both reduced, but the short reduction was greater which led to the increase in net long
- “Other” increased long positions by 22% from 14k to 17k
- “Other” now represents the largest net long position in the group
- Non-Reportables actually fell 23% over the month from 15.6k to 12k
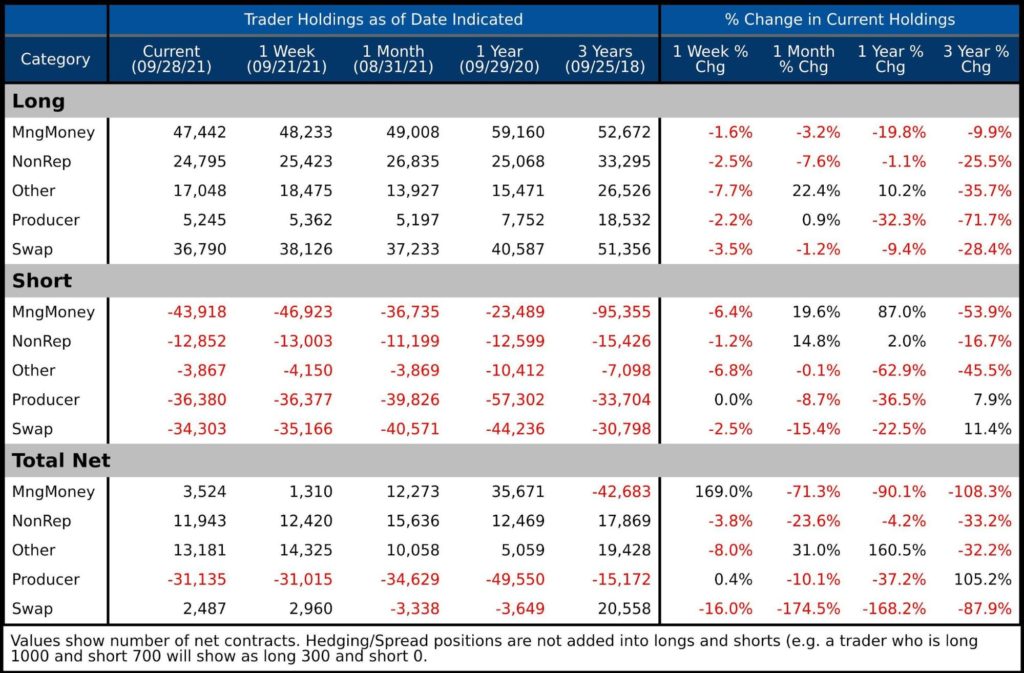
Figure: 9 Silver Summary Table
Historical Perspective
Looking over the full history of the COTs data by month produces the chart below. The chart shows the last run-up in price in 2011, followed by the slow fall into 2015. The price collapse in silver in 2020 is clearly visible in this chart. As can be seen, gross longs are still well above the 2020 lows.
Figure: 10 Gross Open Interest
The CFTC also provides Options data. This has mainly been dominated by Non-Reportables, exceeding even Producers. Options have fallen off significantly from the spike last July and is still well below the peak in 2011.
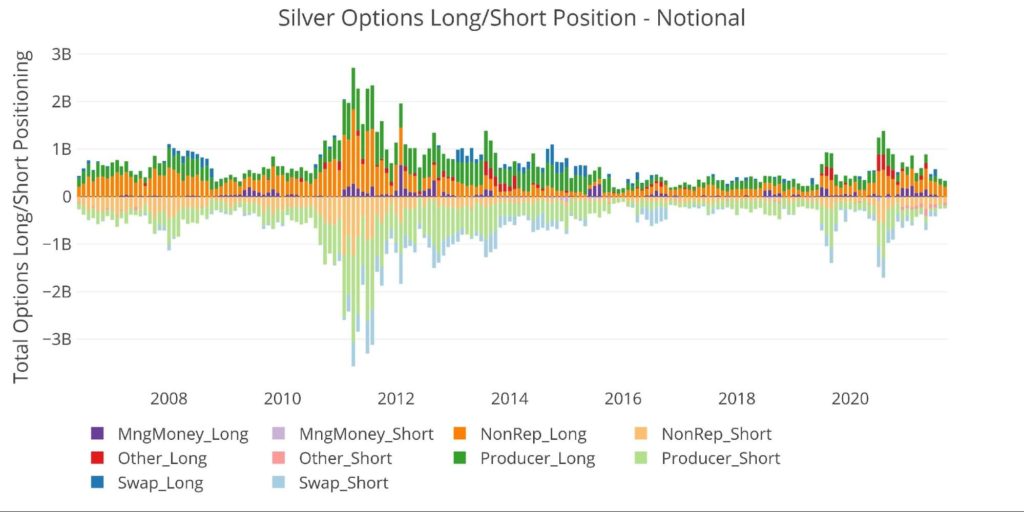
Figure: 11 Options Positions
Finally, looking at historical Net positioning shows the correlation of positioning with price. Similar to gold, the peaks and valleys in price are mirrored in the open interest.
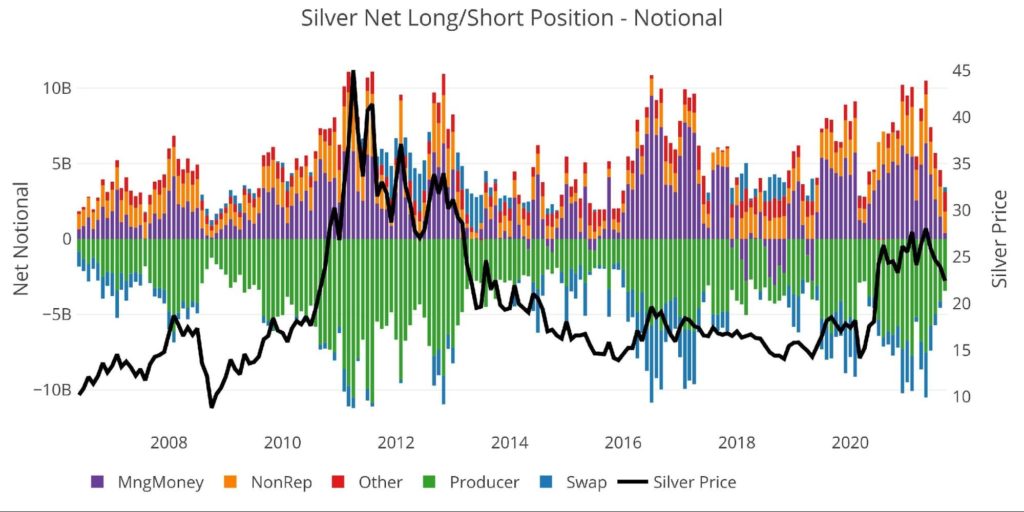
Figure: 12 Net Notional Position
Conclusion: Cautious Optimism
Last month the setup looked bullish, especially with an abysmal jobs report. The washout seemed over and the tide had turned. Unfortunately, the market had different plans as Managed Money piled into short positions. Another washout will push net positions negative for Hedge Funds. While not impossible by any stretch, it does seem improbable. That being said, in Aug 2020 did anyone think gold and silver would be under 2,000 and 30 by Oct 2021 given the macro environment? Don’t rule out the unthinkable just because it seems improbable.
Regardless, the writing on the wall is clear. Any more large sell-offs should be looked at as short-term buying opportunities. There is no way out of this mess, and given the most recent testimonies from Powell and Yellen they most certainly know it!