There’s an old saying: everyone thinks that they’re middle-class.
But how many people think, or know, that they really belong to the top 1% in the country?
This article was written by Pallavi Rao and originally published by Visual Capitalist.
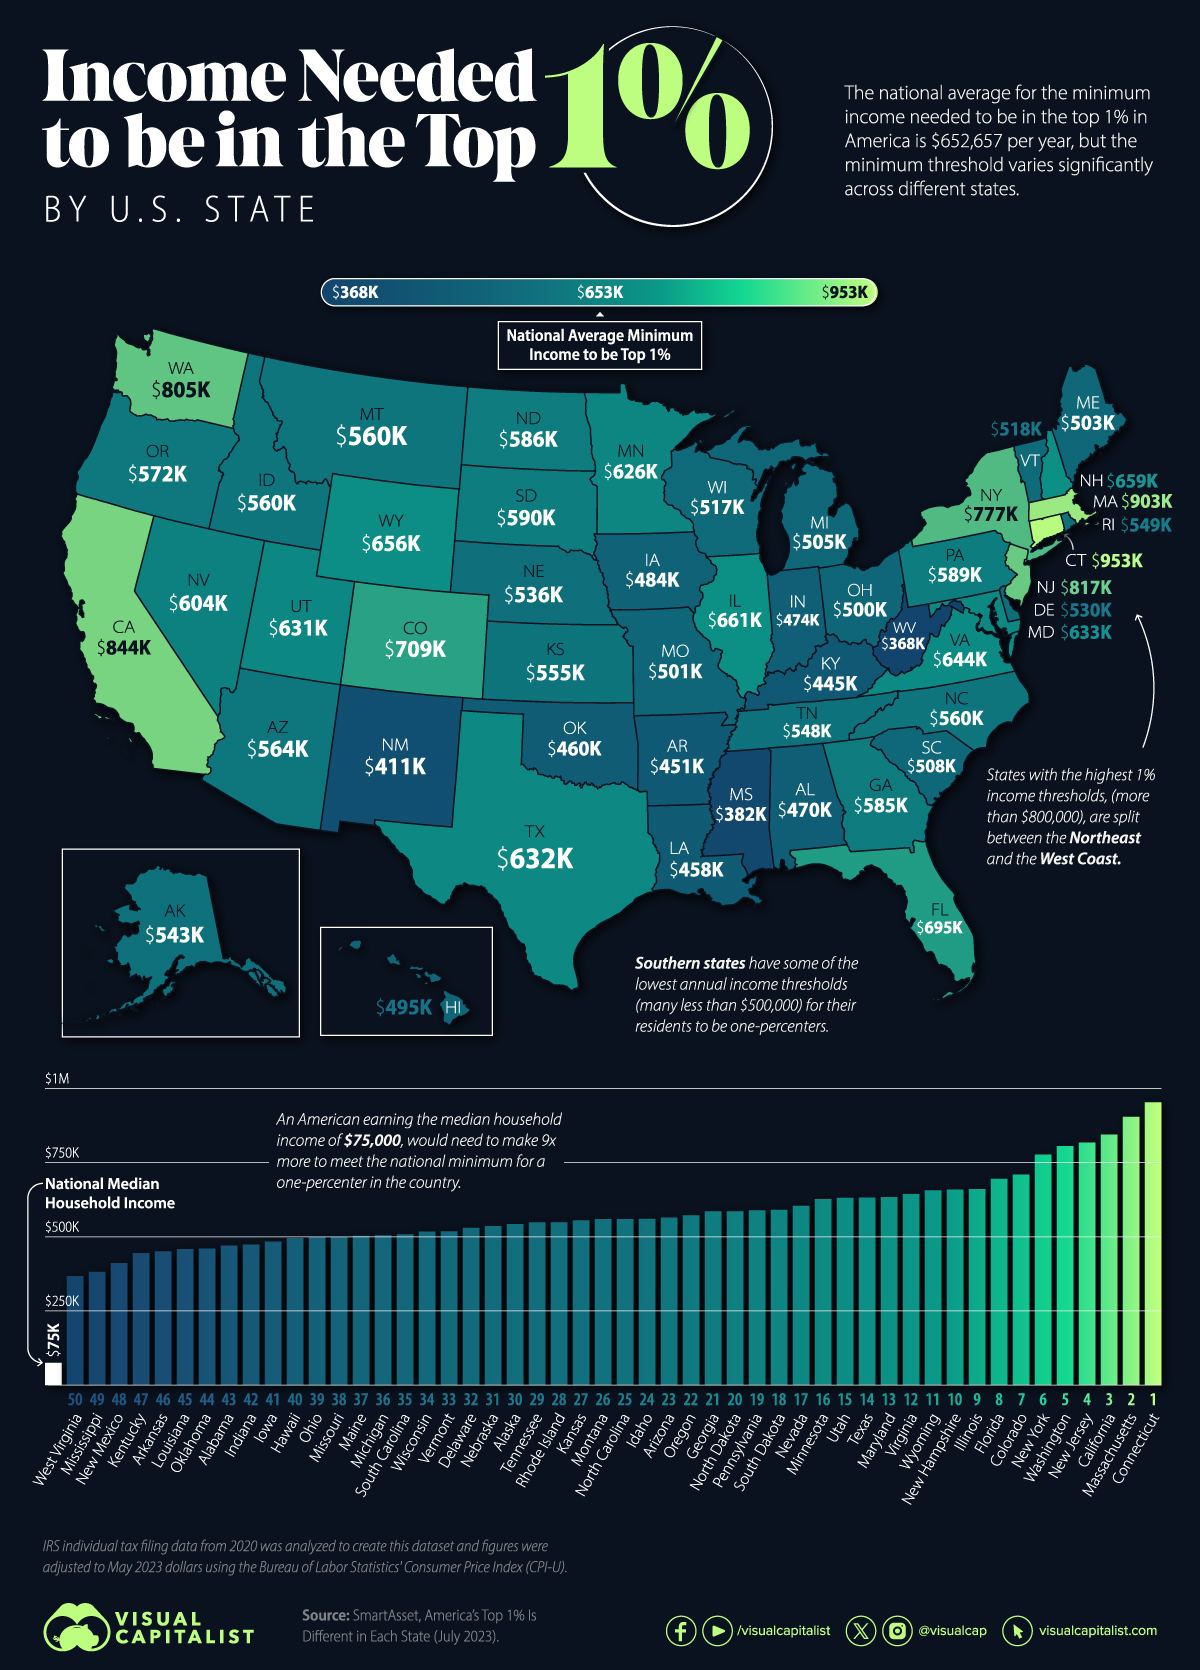
Data from personal finance advisory services company, SmartAsset, reveals the annual income threshold at which a household can be considered part of the top 1% in their state.
Some states demand a much higher yearly earnings from their residents to be a part of the rarefied league, but which ones are they, and how much does one need to earn to make it to the very top echelon of income?
Ranking U.S. States By Income to Be in the Top 1%
At the top of the list, a household in Connecticut needs to earn nearly $953,000 annually to be part of the one-percenters. This is the highest minimum threshold across the country.
In the same region, Massachusetts requires a minimum annual earnings of $903,401 from its top 1% residents.
Here’s the list of the top 11 U.S. states along with the annual income needed to be in the 1%.
| Rank | State | Top 1% Income Threshold |
Top 1% Tax Rate (% of annual income) |
|---|---|---|---|
| 1 | Connecticut | $952,902 | 28.40% |
| 2 | Massachusetts | $903,401 | 27.15% |
| 3 | California | $844,266 | 26.95% |
| 4 | New Jersey | $817,346 | 28.01% |
| 5 | Washington | $804,853 | 25.99% |
| 6 | New York | $776,662 | 28.29% |
| 7 | Colorado | $709,092 | 25.86% |
| 8 | Florida | $694,987 | 25.82% |
| 9 | Illinois | $660,810 | 26.35% |
| 10 | New Hampshire | $659,037 | 26.25% |
| 11 | Wyoming | $656,118 | 24.79% |
| N/A | National Median Household Income |
$75,000 | N/A |
California ($844,266), New Jersey ($817,346), and Washington ($804,853) round out the top five states with the highest minimum thresholds to make it to their exclusive rich club.
On the other end of the spectrum, the top one-percenters in West Virginia make a minimum of $367,582 a year, the lowest of all the states, and about one-third of the threshold in Connecticut. And just down southwest of the Mountain State, Mississippi’s one-percenters need to make at least $381,919 a year to qualify for the 1%.
A quick glance at the map above also reveals some regional insights.
The Northeast and West Coast, with their large urban and economic hubs, have higher income entry requirements for the top 1% than states in the American South.
This also correlates to the median income by state, a measure showing Massachusetts households make nearly $90,000 a year, compared to Mississippians who take home $49,000 annually.
How Much Do the Top 1% Pay in Taxes?
Meanwhile, if one does make it to the top 1% in states like Connecticut and Massachusetts, expect to pay more in taxes than other states, according to SmartAsset’s analysis.
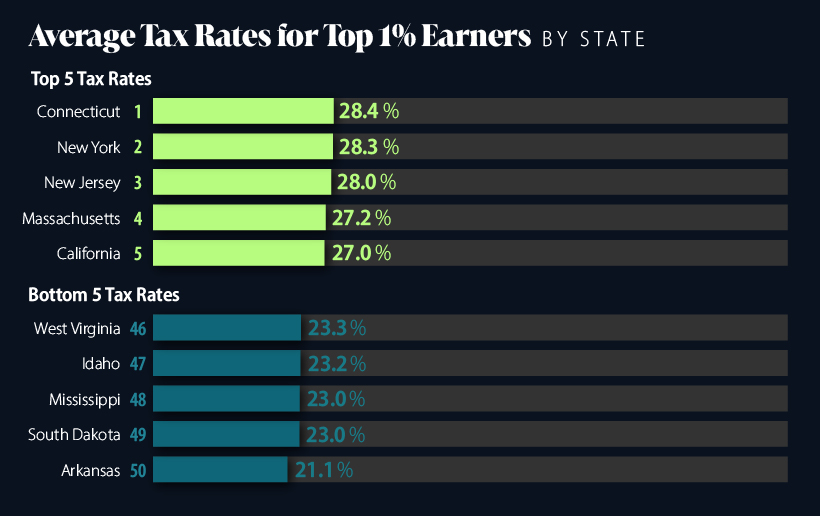
The one-percenters in the top five states pay, on average, between 26–28% of their income in tax, compared to those in the bottom five who pay between 21–23%.
And this pattern exists through the dataset, with higher top 1% income thresholds correlating with higher average tax rates for the wealthy.
| State Ranks | Median Tax Rate |
|---|---|
| Top 10 | 26.65% |
| 20-30 | 25.09% |
| 30-40 | 24.65% |
| 10-20 | 25.07% |
| 40-50 | 23.75% |
These higher tax rates point to attempts to reign in the increasing wealth disparity in the nation where the top 1% hold more than one-third of the country’s wealth, up from 27% in 1989.