The results of Fed interest rate policy are both clear and damming.
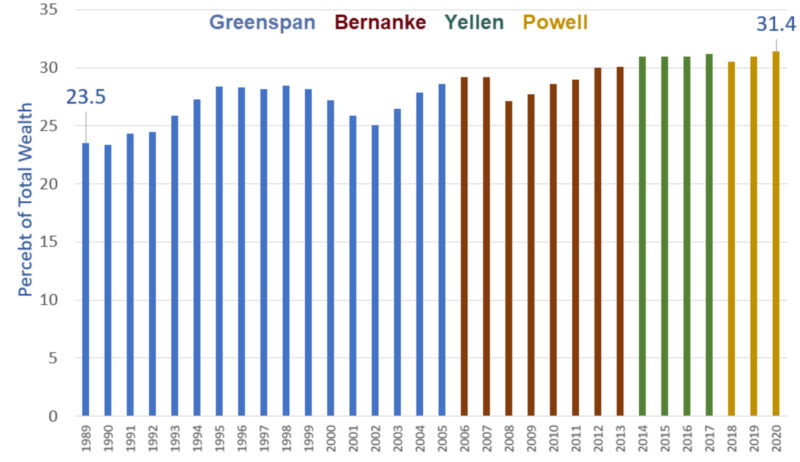
Of the total USA net worth (assets minus liabilities) the percentage net worth of the top 1% rose from 23.5% to 31.4% between 1989 and 2021.
This article was originally published by Mish Talk.com.
Data for this series was downloaded from the Fed report Distribution of Household Wealth in the U.S. since 1989
The charts all show end-of-year figures with the Fed chair at that time in colors.
Percentage Net Worth of the Next 9%
Of the total USA net worth (assets minus liabilities) the percentage net worth of the next 9% rose from 37.2% to 38.2% between 1989 and 2021.
The total net worth of the top 10% rose from 60.7% to 69.6% between 1989 and 2021.
Percentage Net Worth of the Next 40%
The Fed made consistent “progress” here in its goal to shift assets to the top 10%.
Of the total USA net worth (assets minus liabilities) the percentage wealth of the next 40% fell from 35.7% to 28.3% between 1989 and 2021.
Percentage Net Worth of the Bottom 50%
The bottom 50% of the nation never owned anything and never will.
Nonetheless, special merit goes to Fed Chair Ben Bernanke on whose watch the percentage net worth of the bottom 50% nearly fell to 0.0%.
Let’s now discuss percentage ownership of equities which includes mutual funds and bonds.
Percentage of Equities Owned by the Top 1%
On the equities front, the top 1% owned 42.2% of total equity position in 1989. That rose to 53.1% at the end of 2020.
Percentage of Equities Owned by the Next 9%
On the equities front, the next 9% owned 39.5% of equities in 1989. That fell to 35.4% in 2020.
This is a choppy series but clearly headed in the right direction. The Fed’s unstated goal, of course, is for inflation to benefit the top 1% and no one else.
Meanwhile, the Fed can take heart in the fact the share of the top 10% share of equities rose from 81.7% in 1989 to 88.5% in 2001. 99% is in sight.
Percentage of Equities Owned by the Next 40%
On the equities front, the next 40% owned 17.1% in 1989. That fell to 10.9% in 2020.
Bernanke did not make much progress on the transfer of equities to to top 10%, but as we will see later, he was stellar on the real estate front.
Percentage of Equities Owned by the Bottom 50%
The bottom 50% owned 1.1% of equities in 1989. That fell to 0.6% in 2020.
There was little room for progress on the transfer of equities to the top 10% from this group as the mission was nearly complete already by 1989.
Nonetheless, the Fed did capture nearly half of what was possible.
Fed’s Unstated Goal
I sarcastically commented that the Fed’s goal is for the top 10% to own all the assets and everyone else the debt.
That is not their stated goal, of course, but that is the result.
The Fed’s inflation policies make homes unaffordable and make it hard for half the nation to save anything at all or buy assets.
In contrast, the Fed’s inflation policies, bank bailouts, and stock market support has done wonders for the top 10%.
The next 40% is losing dramatically to the top 10%.
Stated Inflation Targeting
These events happen in response to the Fed’s stated inflation policies. The Fed specifically targets housing by keeping interest rates too low. In response, the price of housing has soared.
Case-Shiller Home Prices
Inflation a Tax on Consumers
Inflation is a Fed-sponsored tax on consumers. The bottom 50% are getting killed by it.
Yet the Fed wants more of it. It is thus a direct sponsor or wealth inequality.
Hello Fed, Inflation is Rampant and Obvious, Why Can’t You See It?
Home prices have soared well beyond the means of the bottom 50%.
The Fed does not count this as “consumer inflation”.
What’s important? Inflation or the Fed’s and BLS’s perverted sense of inflation?
I strongly suggest the former.
And if we substitute home prices for Owners’ Equivalent Rent (OER) in the CPI we get a better sense of how far off base the Fed and BLS is regarding inflation.
If you don’t like house prices in the CPI then drop the C and rename the index. However, the result of PI is how the Fed has destroyed the middle class for the primary benefit of the top 10%.


