“Traffic crashes kill 40,000 people and injure 3 million every year in the U.S.,” the Vision Zero Network, a nationwide effort to reduce traffic deaths, notes on its website. When cities across the country adopt Vision Zero, they’re expressing a commitment to bringing that figure down, from 40,000 to zero.
This article was written by Asia Mieleszko and originally published by Strong Towns.
What that commitment looks like in practice differs by city. Hoboken and Jersey City, neighboring municipalities in New Jersey that both achieved zero traffic deaths, focus on design choices and swiftness. Other cities, like Philadelphia and Denver, concentrate their efforts on outreach and education.
A core practice within the Vision Zero network is the collection, interpretation, and visualization of data. “When it comes to advancing Vision Zero, data is crucial to set goals and strategies and measure progress to eliminate roadway fatalities and serious injuries,” the network asserts. That’s why Vision Zero came up with the High-Injury Network (HIN), a map illustrating that the majority of crashes happen on the minority of streets.
For many cities, seeing a concentration of fatal and near-fatal crashes on just a handful of streets was illuminating. For constituents, the data only confirmed what they knew from experience. Nevertheless, HIN maps continue to be a compelling storytelling tool. In fact, for the advocate interested in examining their city’s crash history, the HIN data set is often the only publicly accessible tool.
Yet, the HIN isn’t meant to be accurate and up-to-date. It’s meant to showcase trends. Many cities update it annually, some every two to four years. A few maintain an interactive crash map that is updated every month or so, but on the whole, cities that have enshrined Vision Zero in their comprehensive plans are failing to document and provide accessible up-to-date information on the crashes that take place on their streets.
“Can you imagine if police departments updated their crime records only once a year?” Edward Erfurt, Strong Towns director of community action, asked. “That just wouldn’t happen.”
Erfurt is right. In just a sampling of cities across the country, it’s apparent that police and sheriffs’ departments are diligent about publicizing criminal activity. Philadelphia, for example, offers two separate online maps showcasing violent and non-violent crime across the city, both updated daily. In one devoted to just gun violence, users can also customize their experience through filters. As of this writing, the map was updated less than 24 hours ago. Those in Miami can access up-to-the-minute updates from CrimeMapper, into which the city feeds its data. In Dallas, those interested in the city’s crime rates have multiple daily and weekly digests at their disposal.
As of this writing in 2024, Dallas, which adopted Vision Zero in 2022, has detailed bicycle and pedestrian crash data available for the years 2018–2022. In addition to being outdated, that interactive map is noticeably less detailed and user friendly than the crime dashboard.

Since formally launching its Vision Zero program in 2021, Miami-Dade County has input crash data into a GIS map that likewise catalogs information about county demographics, rainfall, and upcoming redesign projects. As of 2024, that map showcases crash data for the years 2018–2022.
In Philadelphia, which took the Vision Zero pledge in 2016, nonprofits and ad hoc developers took on the responsibility of building and maintaining up-to-date bicycle and pedestrian crash data. Constrained by limited resources, one of the attempts lasted six years, 2011–2017. The city’s Vision Zero site hosts its annual reports, but doesn’t offer a real-time map of crashes. The latest data, like with the other cities, is from 2018–2022.
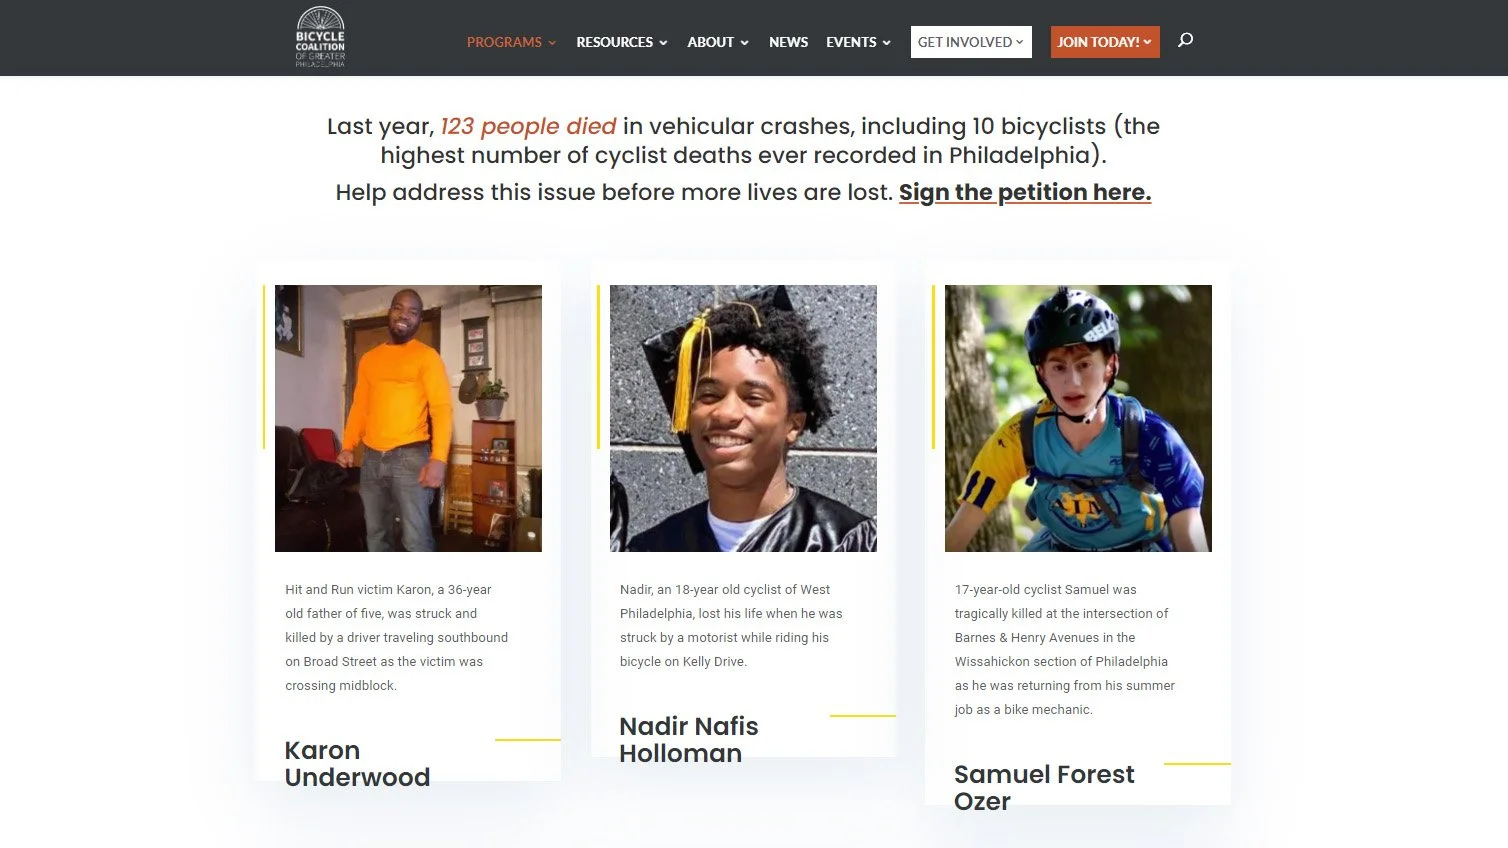
At present, the best effort to catalog crashes in the city is maintained by the Bicycle Coalition of Greater Philadelphia, a nonprofit that advocates for safer street infrastructure and trails for all bicycle users. Their TrafficVictimsPHL dashboard offers minute-by-minute updates on traffic fatalities in the region, as well as a humanizing memorial to crash victims.
“When this data is not available in real time, it dulls the urgency,” Strong Towns President Chuck Marohn noted. “Instead, there’s a death statistic published 18 months later, completely divorced from the place of where it happened. Instead, the city maps a trend for the year or the last five years, but what about what actually happened? In the specific place where it happened?”
It’s not that tracing trends isn’t important for Vision Zero cities. In fact, Marohn and Erfurt concede that processing, analyzing, and interpreting data to uncover trends is something cities are good at. Yet, doing so is not only time consuming, it risks losing much of the detail actively contributing to the trend. As a result, many cities that have adopted Vision Zero have only seen an increase in serious injuries and fatalities on their streets. They’re able to see and acknowledge the upward trend but are seemingly powerless to reverse it.
Additionally, compared to how readily respective city and state agencies collect and publish crime data, Marohn also can’t help but figure that documenting crashes is just not a priority.
“If the city cared about traffic deaths, we would witness them taking an urgent response to crashes. We would see city hall tracking traffic deaths in real time, because a new fatal crash would mobilize people,” he explained. “You track what you care about”