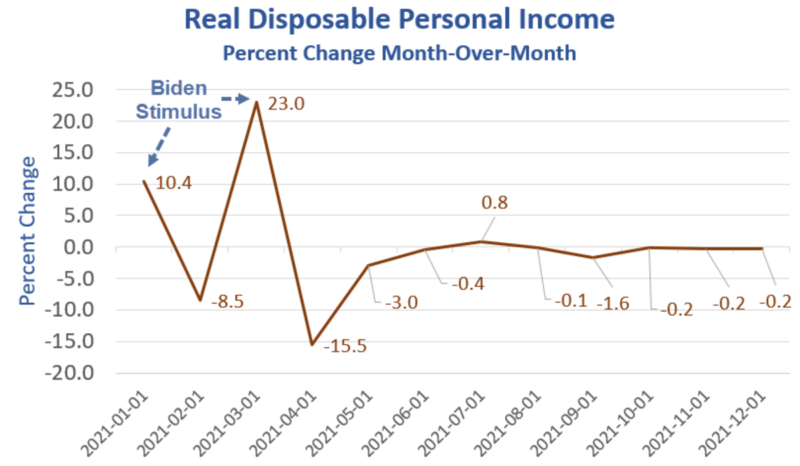
Inflation has eaten up every penny of income gains for the last year.

Today the Bureau of Economic Analysis released Personal Income and Outlays data for the month, and it looks grim.
This article was originally published by Mish Talk.
Details
- Personal income increased $70.7 billion (0.3 percent) in December
- Disposable personal income (DPI) increased $39.9 billion (0.2 percent)
- Personal consumption expenditures(PCE) decreased $95.2 billion (0.6 percent).
- Real DPI decreased 0.2 percent in December
- Real PCE decreased 1.0 percent; goods decreased 3.1 percent and services increased 0.1 percent
- The PCE price index increased 0.4 percent.
- Excluding food and energy, the PCE price index increased 0.5 percent
Real means inflation adjusted. Real spending fell 1 percent in December with spending on goods down 3.1 percent.
Personal income and disposable personal income rose 0.3 percent and 0.2 percent respectively, but real disposable personal income was a disaster.
Real Disposable Personal Income Details
- Down 5 consecutive months
- Down 8 out of the last nine months
Those numbers are based on the PCE price index, not the CPI. The PCE price index is understated relative to the CPI. Both are grossly understated factoring in housing prices.
Personal Income and Real Personal Income
Personal Income and Real Personal Income Details
- Note the three spikes. You can see two of them in the lead chart as well. Those reflect three rounds of fiscal stimulus, one under President Donald Trump and two under President Joe Biden.
- Real disposable personal income is about where it was a year ago. Inflation has eaten every penny even by dramatically understated PCE price measures.
- Real disposable personal income was 15,069 pre-pandemic. It’s now 15,367. That’s a total rise of 1.9% in just under two years, assuming you believe reported measures of inflation.
Personal Income and Real Personal Income Since 1959
Personal income is on a slow exponential rising trend. But all of that is due to population increase. A good way to account for growth is on a per capita basis.
Real Disposable Personal Income Per Capita
With boomers retiring en masse, guess where this is headed.
Real Disposable Personal Income Per Capita Since 2020
Real Disposable Personal Income Per Capita Details
- Again, note the three fiscal stimulus spikes.
- Real disposable personal income per capita is less than where it was a year ago. Inflation has eaten more than every penny.
4th Quarter GDP Up 6.9% Is Mostly An Artificially Boosted Illusion
The impact of three rounds of fiscal stimulus are over. Meanwhile, a massive inventory build by merchants is underway.
I discussed the current setup in GDP Up 6.9% Is Mostly An Artificially Boosted Illusion
Inventory Adjustments
Change in Private Inventories (CIPI) added a whopping 4.9 percentage points to real GDP in the fourth quarter. Since inventories net to zero over time, the true bottom-line estimate of real GDP was 2.0%.
For the third quarter, CIPI added 2.20 percentage points to real GDP.
Thus, of the reported 2.3% GDP gain for the third quarter, nearly the entire rise was an inventory adjustment.
Retail Sales Unexpectedly Flop in December, Down 1.9 Percent
On January 14, I noted Retail Sales Unexpectedly Flop in December, Down 1.9 Percent
Here We Are!
- The Fed is hiking
- Stimulus has worn out
- The stock market is stumbling
- Pending Homes Sales Unexpectedly Decline 3.8 Percent in December
- Merchants are stockpiling and pre-ordering everything
- Retail sales are falling
- Major deceleration in deficit spending.
- Declining working age population will reduce productivity
The Fed has everything under control. So, what can possibly go wrong?
I now expect a recession no later than the end of 2023.


