This article was originally published by Mish Talk.
Key Points
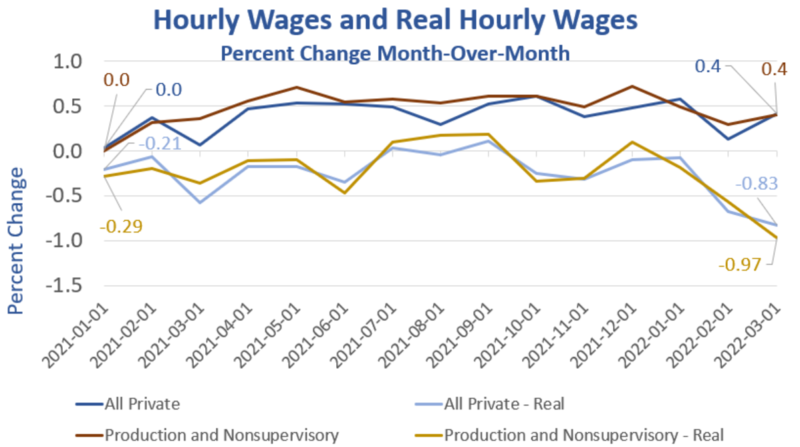
- Real average hourly earnings for all employees decreased 0.8 percent from February to March, seasonally adjusted, the U.S. Bureau of Labor Statistics (BLS) reported today.
- This result stems from an increase of 0.4 percent in average hourly earnings combined with an increase of 1.2 percent in the Consumer Price Index for All Urban Consumers (CPI-U).
- For all workers, real wages declined for the 13th time in 15 months.
- Real average hourly earnings for production and nonsupervisory employees decreased 0.9 percent from February to March, seasonally adjusted. This result stems from a 0.4-percent increase in average hourly earnings combined with an increase of 1.4 percent in the Consumer Price Index for Urban Wage Earners and Clerical Workers (CPI-W).
- For production and nonsupervisory workers, real wages declined for the 11th time in the last 15 months.
Real Hourly Wages by Month
The BLS says the decline for production and nonsupervisory workers is 0.9 percent in March. I calculate a decline of 0.97 percent. There is a small rounding issue somewhere.
I take the seasonally-adjusted change in Average Hourly Earnings of Production and Nonsupervisory Employees, Total Private, Dollars per Hour, and subtract the seasonally-adjusted change in the Consumer Price Index for All Urban Wage Earners and Clerical Workers: All Items in U.S. City Average.
Fred does the calculation for me (It’s simply a-b). There is a small rounding error somewhere.
Year-Over-Year Real Wages
Year-Over-Year Real Wages
- Production: Year-over year, I calculate a decline in real wages for production and nonsupervisory workers of 2.42 percent. The BLS reports 2.4%
- All Workers: Year-over year, I calculate a decline in real wages for all workers of 2.77 percent. The BLS reports 2.7%
Year-over-year real wages have declined for 12 consecutive months.
CPI Rips Higher to 8.5 Percent From a Year Ago, the Most Since 1981
The CPI is a key input to real wages.
For discussion of the CPI in March, please see CPI Rips Higher to 8.5 Percent From a Year Ago, the Most Since 1981.


