One of the most popular foods in America is pizza, and while it’s not surprising that pizza chains are numerous, some of the names in the top ten for market share, nationwide, are.
This article was written by Marcus Lu and originally published by Visual Capitalist.
About 3 billion pizzas are sold annually in the United States. In 2022, pizza restaurant sales in the U.S. reached an all-time high of $46.9 billion, an increase of roughly $10 billion compared to just a decade prior.
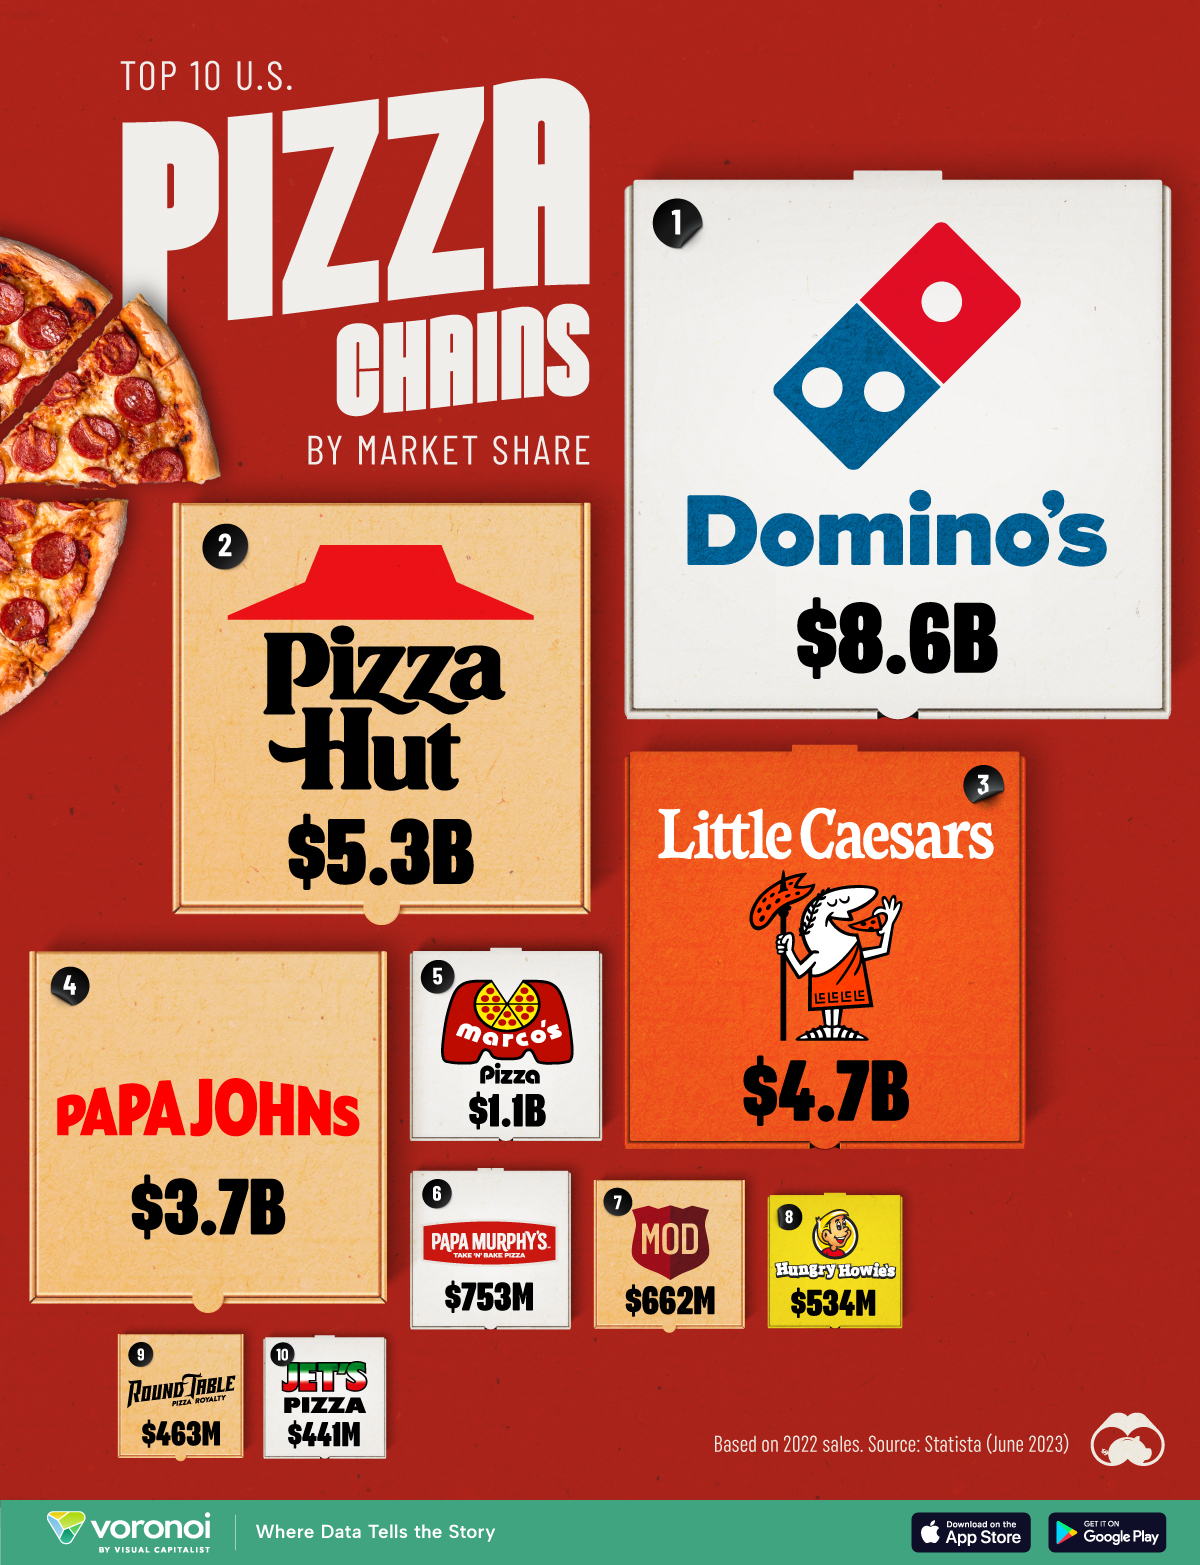
This graphic lists the top 10 U.S. pizza chains based on 2022 sales figures. This data was accessed via Statista (published June 2023).
Domino’s Domination
Domino’s is the biggest pizza chain in the U.S. by sales, reaching $8.6 billion in revenue in 2022. The brand is also found in 90 other countries around the globe, including stores on every continent except Antarctica.
According to Domino’s main website, there are over 20,500 locations worldwide, which collectively serve over 1 million customers per day.
Domino’s is followed by Pizza Hut with $5.3 billion in revenue. Little Caesars, with $4.7 billion, completes the top three.
| Company | 2022 Revenue (USD) |
|---|---|
| Domino’s Pizza | 8,572,000,000 |
| Pizza Hut | 5,270,000,000 |
| Little Caesars | 4,724,000,000 |
| Papa Johns | 3,712,000,000 |
| Marco’s Pizza | 1,063,000,000 |
| Papa Murphy’s | 753,000,000 |
| MOD Pizza | 662,000,000 |
| Hungry Howie’s | 534,000,000 |
| Round Table | 463,000,000 |
| Jet’s Pizza | 441,000,000 |
The top end of this ranking contains household names, but regional pizza chains also make the cut. Jet’s Pizza is popular in the Great Lakes region, and most Hungry Howie’s locations can be found in Michigan and Florida.
The overall number of pizza restaurants in the U.S. has been on the rise, reaching more than 80,000 units in 2022.
If you enjoyed this post, be sure to check out this graphic, which visualizes the change in market share of U.S. carbonated soft drinks between 1995 and 2023.