This article was originally published by Mish Talk.

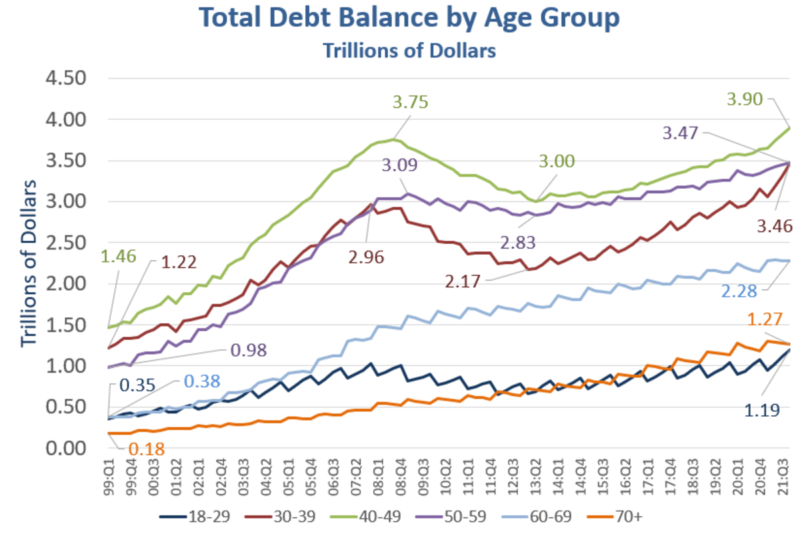
Debt balance by age data from Federal Reserve Bank of New York (FRBNY), chart by Mish.
Age is defined as the current year minus the birthyear of the borrower. Age groups are redefined each year.
Those who are millennials now were not millennials in 1999.
The FRBNY Household Debt Report shows new record debt levels in the fourth-quarter of 2021.
I discussed the overall data in Household Debt Soars to Record $15.58 Trillion in the Fourth Quarter.
The FRBNY chart provides a better handle on the total amount of debt, but the age breakdown is more important.
Age Group Debt Synopsis
- 18-29: $1.19 Trillion
- 30-39: $3.46 Trillion
- 40-49: 3.90 Trillion
- 50-59: $3.47 Trillion
- 60-69: $2.28 Trillion
- 70+: 1.27 Trillion
Debt in age groups 60-69 and 70+ have linear or near-linear trends. Those levels are also much lower than all but age group 18-29.
Those currently age 18-29 have not put on a lot of debt. Most cannot afford to buy a house.
Millennials, currently age 26-41, and Gen-X, currently aged 42-57 are adding debt at a stunning pace.
I can’t help wondering how many of them stretched to buy a house that they can barely afford, if afford at all.
Low interest rates, fear of missing out (FOMO), and the Fed goosing stock markets no doubt set this debt boom in motion.
Debt Deflation Setup
Admittedly there are inherent assumptions in my analysis, mainly that debt is a problem.
Yet, we can easily infer problems by noting what happened when the housing bubble burst. Debt declined. You can see it by the drawdowns in the top chart.
People did not pay down that debt. Rather, bankruptcy wiped it out as people walked away from homes. Others, fearful of debt did not leverage up for many years.
Another strong recession is likely to produce similar results.
Meanwhile, boomers are retiring en masse. Many of them think retirement is safe because of stock market wealth.
A stock market crash is yet another deflationary force I expect will hit with a vengeance.
Supply chains and demand imbalances are inflationary forces now, but deflation will soon be in the batter’s box, about to hit one out of the park.
Despite Rising Bond Yields the Yield Curve is Still Flattening
In case you missed it, please see Despite Rising Bond Yields the Yield Curve is Still Flattening.
The flattening of the yield curve suggests trouble is ahead for the Fed before the Fed even begins hiking.
There’s trouble coming and the bond market has picked it up.


