Trading Time As A Fractal Experience
I’m currently reading Benoit Mandelbrot’s brilliant book The Misbehavior of Markets: A Fractal View of Financial Turbulence (TMM). In it, Mandelbrot makes a case for discarding the bell curve when modeling financial markets, the bedrock of modern financial theory. Instead, he recommends using fractal geometry as a far more accurate lens through which to view markets. However, it’s not just security prices that seem to behave in fractal patterns. Time does too. This observation really resonates with me. I’m simply not experiencing the current, turbulent market moves as furious. Rather, it all seems to be happening in slow motion—in fractal trading time.
This article was written by Seth Levine of Real Investment Advice.com.
Fractals Not Bells
Modern financial theory rests upon the premise that security prices move in accordance with the bell curve (i.e. a normal or Gaussian distribution). This assumption underpins nearly every accepted investment doctrine: from portfolio construction (Modern Portfolio Theory) to option pricing (Black-Scholes). Its truth has been drilled into our heads by university professors, professional credentialing organizations, financial advisors, consultants, and policymakers.
While commonplace, most practitioners will readily admit that such models are approximations at best; not accurate representations of actual security price behaviors. Most notably, the “tails” are fatter than assumed. Large price moves—both gains and losses—occur far more frequently than they would if normally distributed. However, despite this conflict, few discard the familiar theories. More commonly, a “fudge factor” is applied to adjust for discrepancies. It’s an art form, not really science.
In TMM, Mandelbrot dispatches with such approaches altogether. Instead, he builds new models based on fractal geometry. To be sure, it’s less exotic than it first sounds. Fractal distributions are everywhere: from gravity to foraging patterns of various species, to frequencies of family names, to the shape of broccoli. However, Mandelbrot’s application to investing is certainly novel.
“Examine price records more closely, and you typically find a different kind of distribution than the bell curve: The tails do not become imperceptible but follow a ‘power law’ [i.e. fractal distribution]. These are common in nature.”
Benoit Mandelbrot, The Misbehavior of Markets: A Fractal View of Financial Turbulence
Trading Time as Fractal
However, according to Mandelbrot, it’s not just security prices that behave in fractal patterns. Time does too. It moves in so-called “trading time.” Activity is not evenly distributed throughout time. Rather, it is episodic and periodically clusters with times of “high drama” and “low drama.”
“On occasion, trading is fast. Scores of news items are flitting across the electronic ‘crawl’ on the bottom of the screen. Colleagues are waving and shouting all around. Phones are ringing. Customers are zapping electronic orders. The volume of trades is climbing, and prices are flying by. On such days are fortunes won or lost. Time flies (emphasis added). Then there are the slow times. No news, only tired reports from the in-house financial analysts to chew over. The customers seem to be on holiday. Trading is thin. Prices are quiet. No big money to be made here; might as well go for a long lunch. Time hangs heavy (emphasis added).”
Benoit Mandelbrot, The Misbehavior of Markets: A Fractal View of Financial Turbulence
This is consistent with my professional experience. There are times when I’m so busy I don’t eat lunch for days; and others when I could nap all afternoon and not miss a trade. However, I never viewed my activity as a distribution of time as Mandelbrot does. It’s an intriguing application of fractals, to say the least.
“… price-changes in a financial market can cluster into zones of high drama and slow evolution.”
Benoit Mandelbrot, The Misbehavior of Markets: A Fractal View of Financial Turbulence
Today’s Fast and Slow Markets
There is a lot going on in markets these days. They appear turbulent: The S&P 500, rates, high yield bonds, gold, bitcoin, you name it. Markets are no longer on auto drive. They seem to be moving fast.
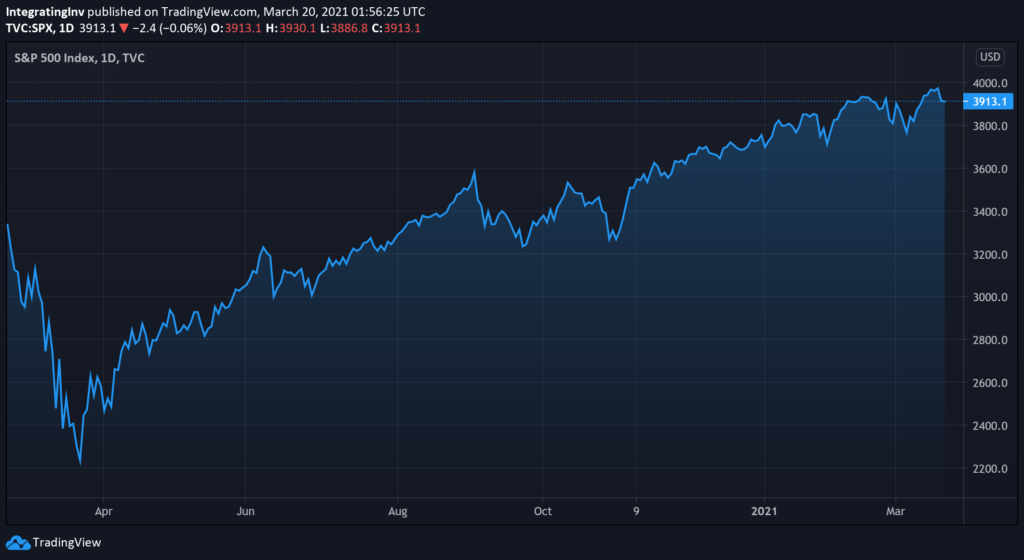
SPX
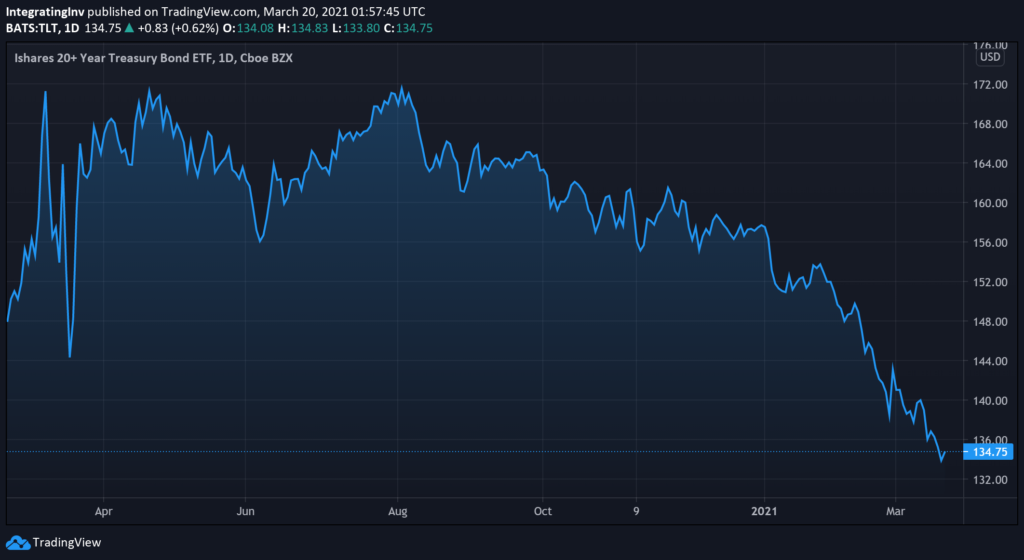
TLT
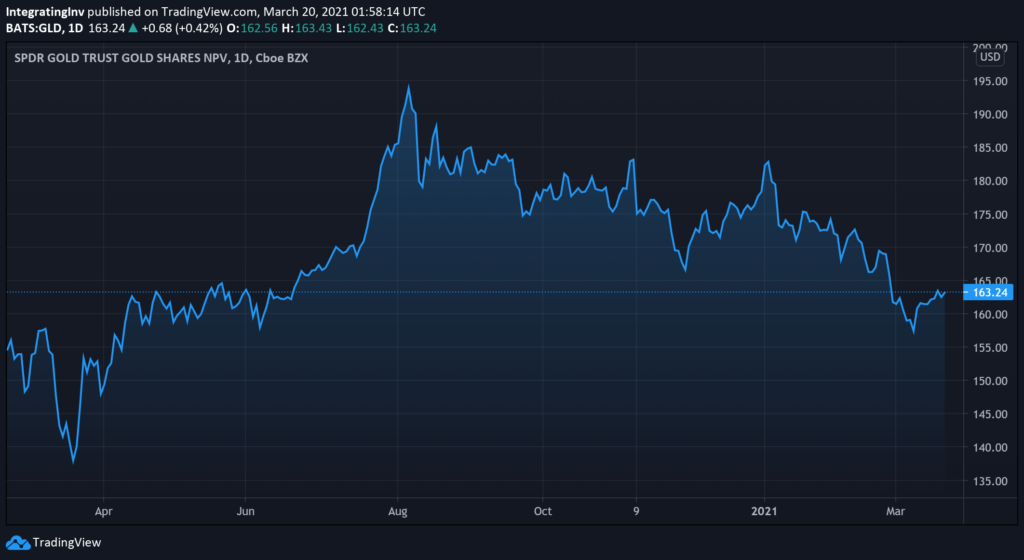
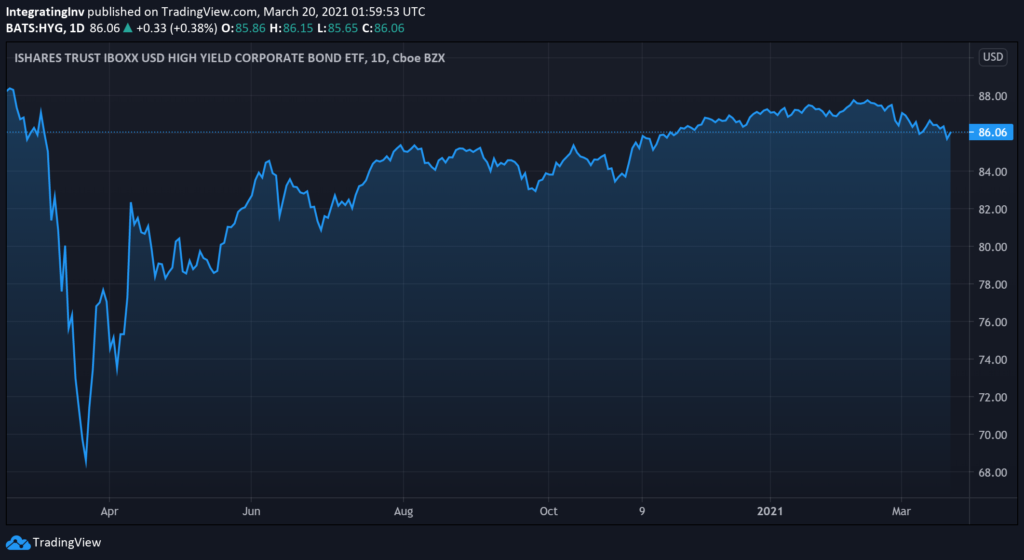
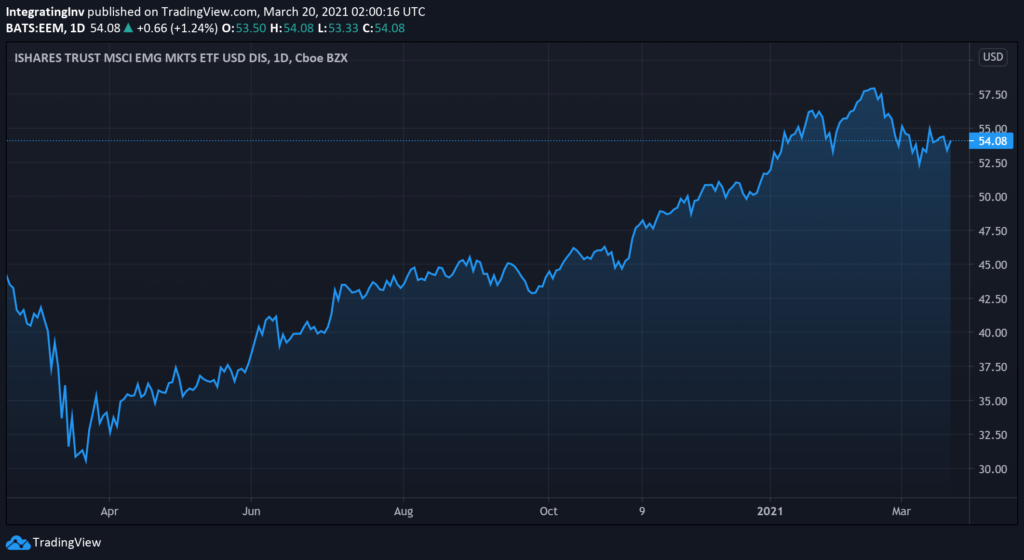
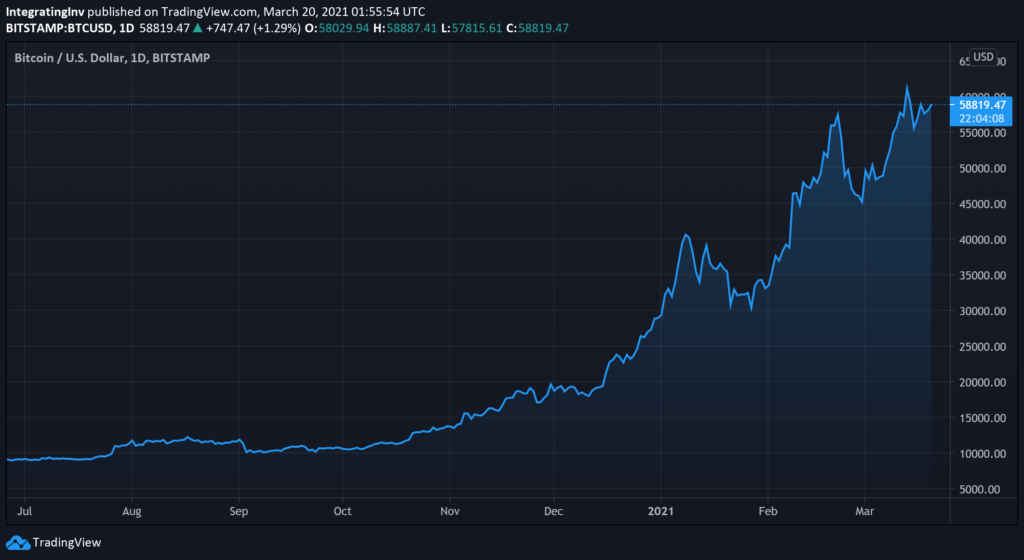
Many markets seem to be moving, and fast! Shown above are prices for the S&P 500 (SPX), U.S. treasury bonds (TLT), gold (GLD), US high yield bonds (HYG), emerging markets stocks (EEM), and bitcoin (BTCUSD).
Yet to me, these gyrations feel like they’re happening in slow motion, not a highly active period. Maybe it’s because I’m myopically absorbed in my own investment work, a case of déjà vu, mere market fatigue, or that I’ve been working from a remote location for a month (for a change in scenery). Whatever the cause, these markets don’t seem as turbulent as they appear. Thus, I can’t help but wonder if Mandelbrot’s trading time is at play.

The Integrating Investor’s temporary headquarters last month.
However, the data support my suspicions. As shown in the charts below, historical volatilities of the markets presented don’t suggest this to be a zone of “high drama”, such as last spring. Rather, it seems like we’re in another period of “slow evolution” (and that the mountain air has not corrupted my senses).
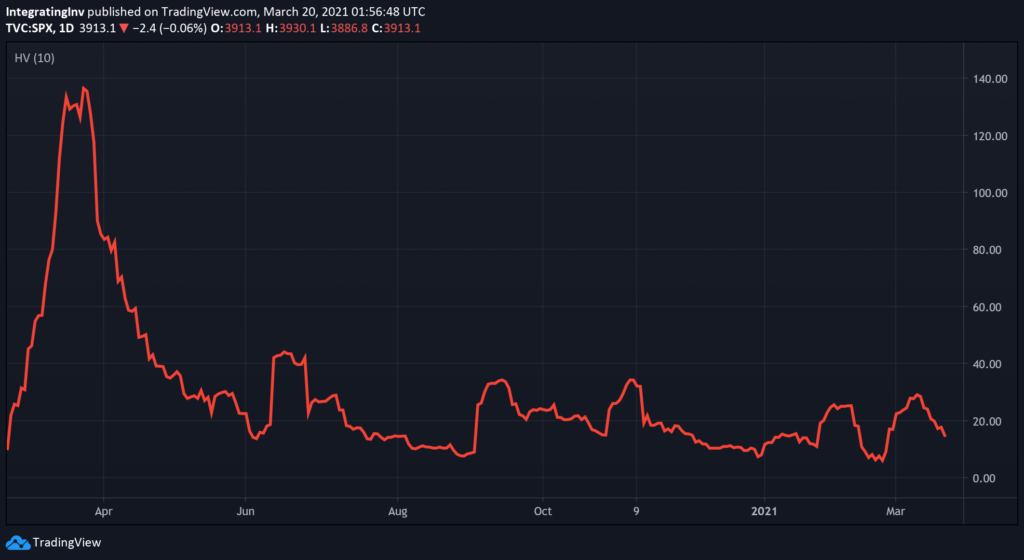
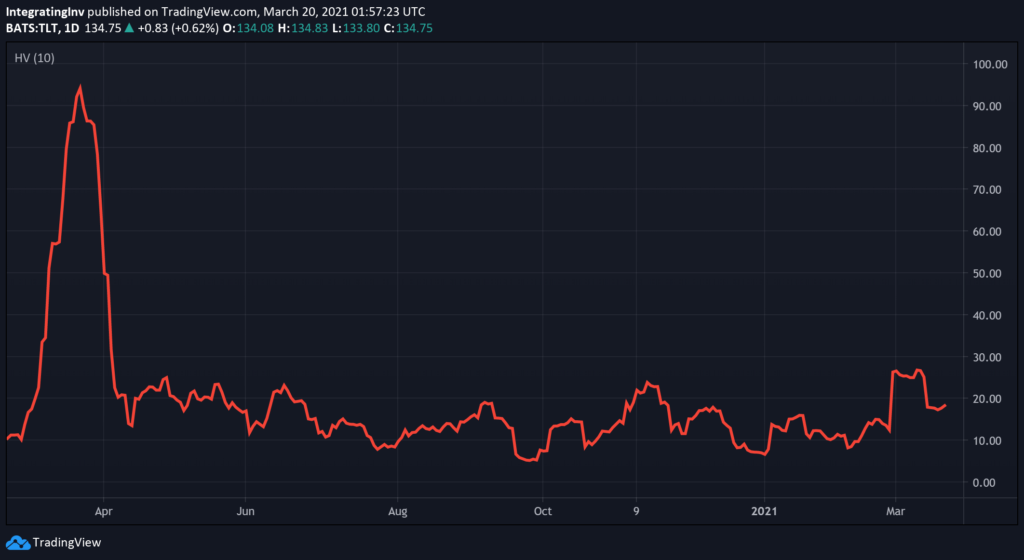
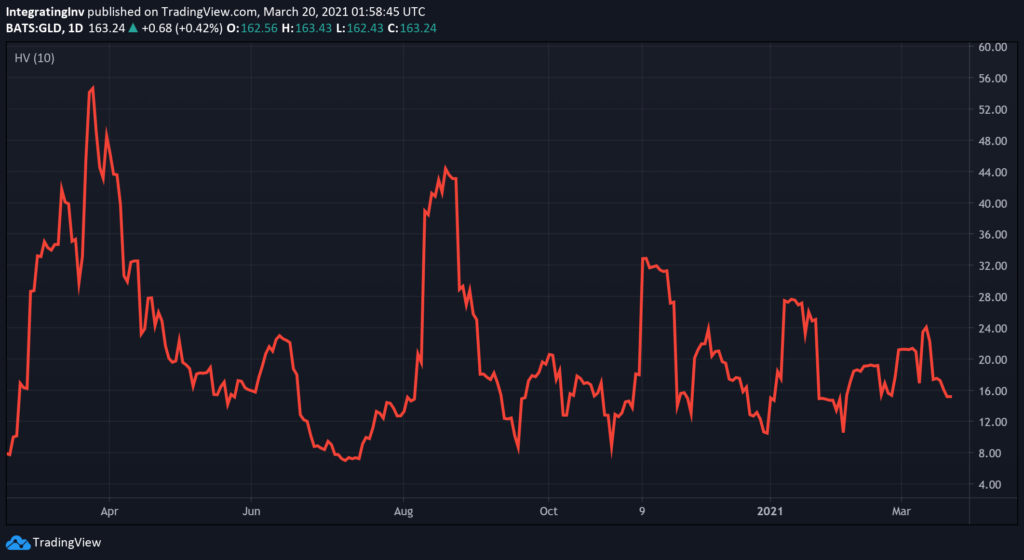
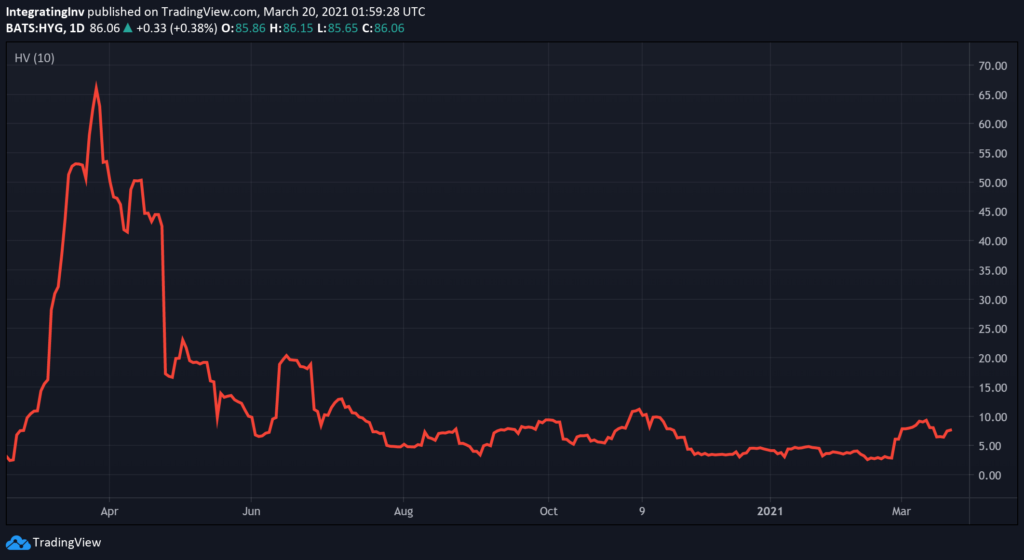
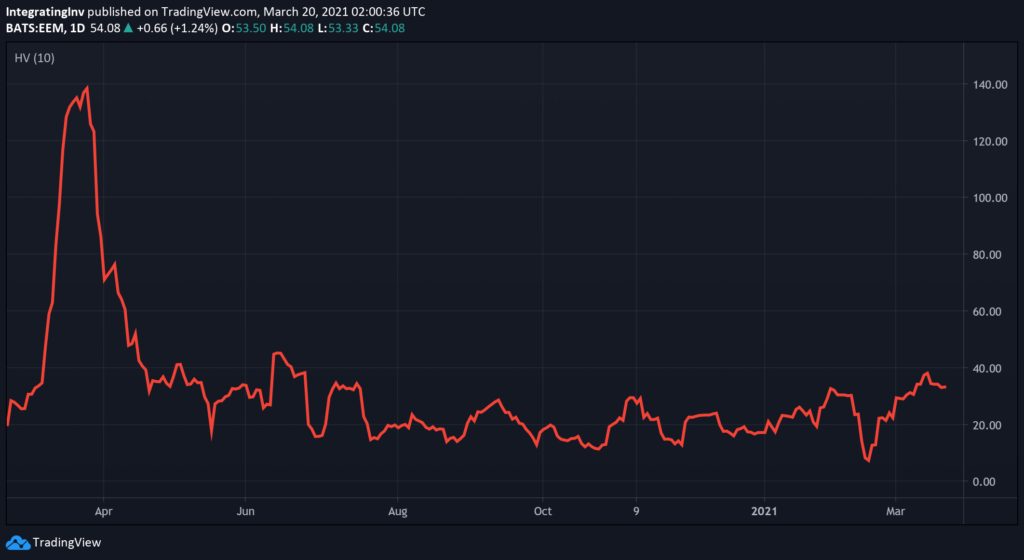
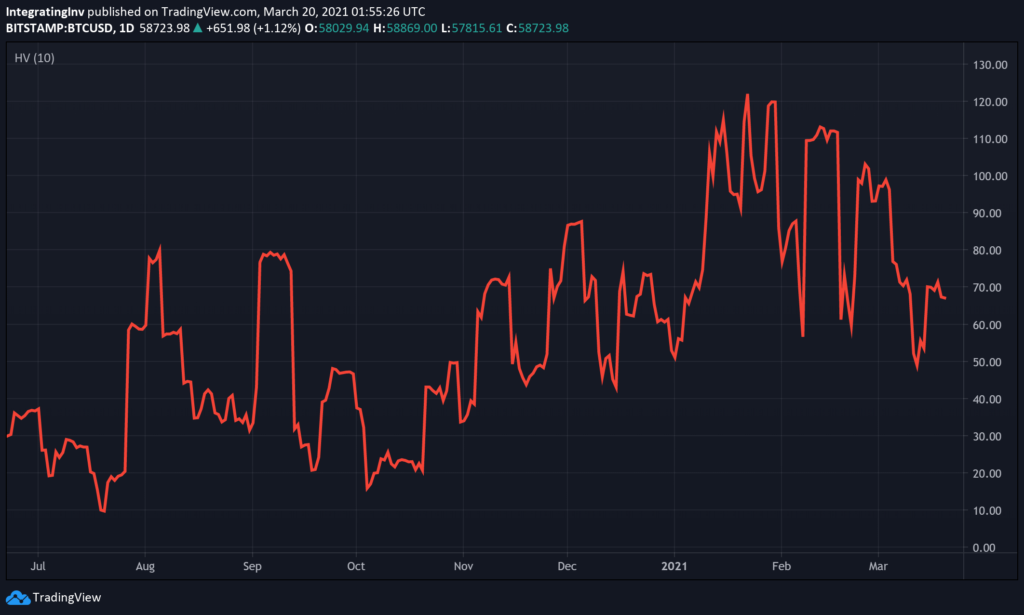
While the recent price moves seem turbulent, historical volatilities for these same markets do not screen as notably high.
Advancing Beyond the Bell Curve
Today’s financial theories rest upon the assumption that investment markets behave according to normal distributions. They generally treat conflicting data, such as the presence of “fat tails”, as inconveniences and basically ignore them. However, these occurrences are immensely important to investment returns. Thus, I readily write off much of conventional theory as useful approximations at best and misleading nonsense at worst.
Mandelbrot’s application of fractal geometry to financial markets is fascinating. While beyond my current expertise, it holds promise for advancing investing knowledge beyond the bell curve.
“Trading time” as a non-linear, fractal distribution is another interesting observation of this framework. My experience of today’s turbulent markets as slow-moving is a consistent anecdote. Thus, even our understanding of time may require updating. The implications are potentially huge. Today’s fast-moving markets may not be so high-drama after all. Maybe, they’re just a slow evolution of price—another calm before a forthcoming cluster of market volatility.