The Federal Government ran a gargantuan deficit of -$378B in March. This is over $100B larger than the massive February deficit. In the last three years, only the deficit last September was larger because the government recognized the cost of Biden’s student loan forgiveness. September aside, this month was the largest deficit month since March 2021 when Biden signed the last Covid deficit bailout package.
This article was originally published by Schiff Gold.
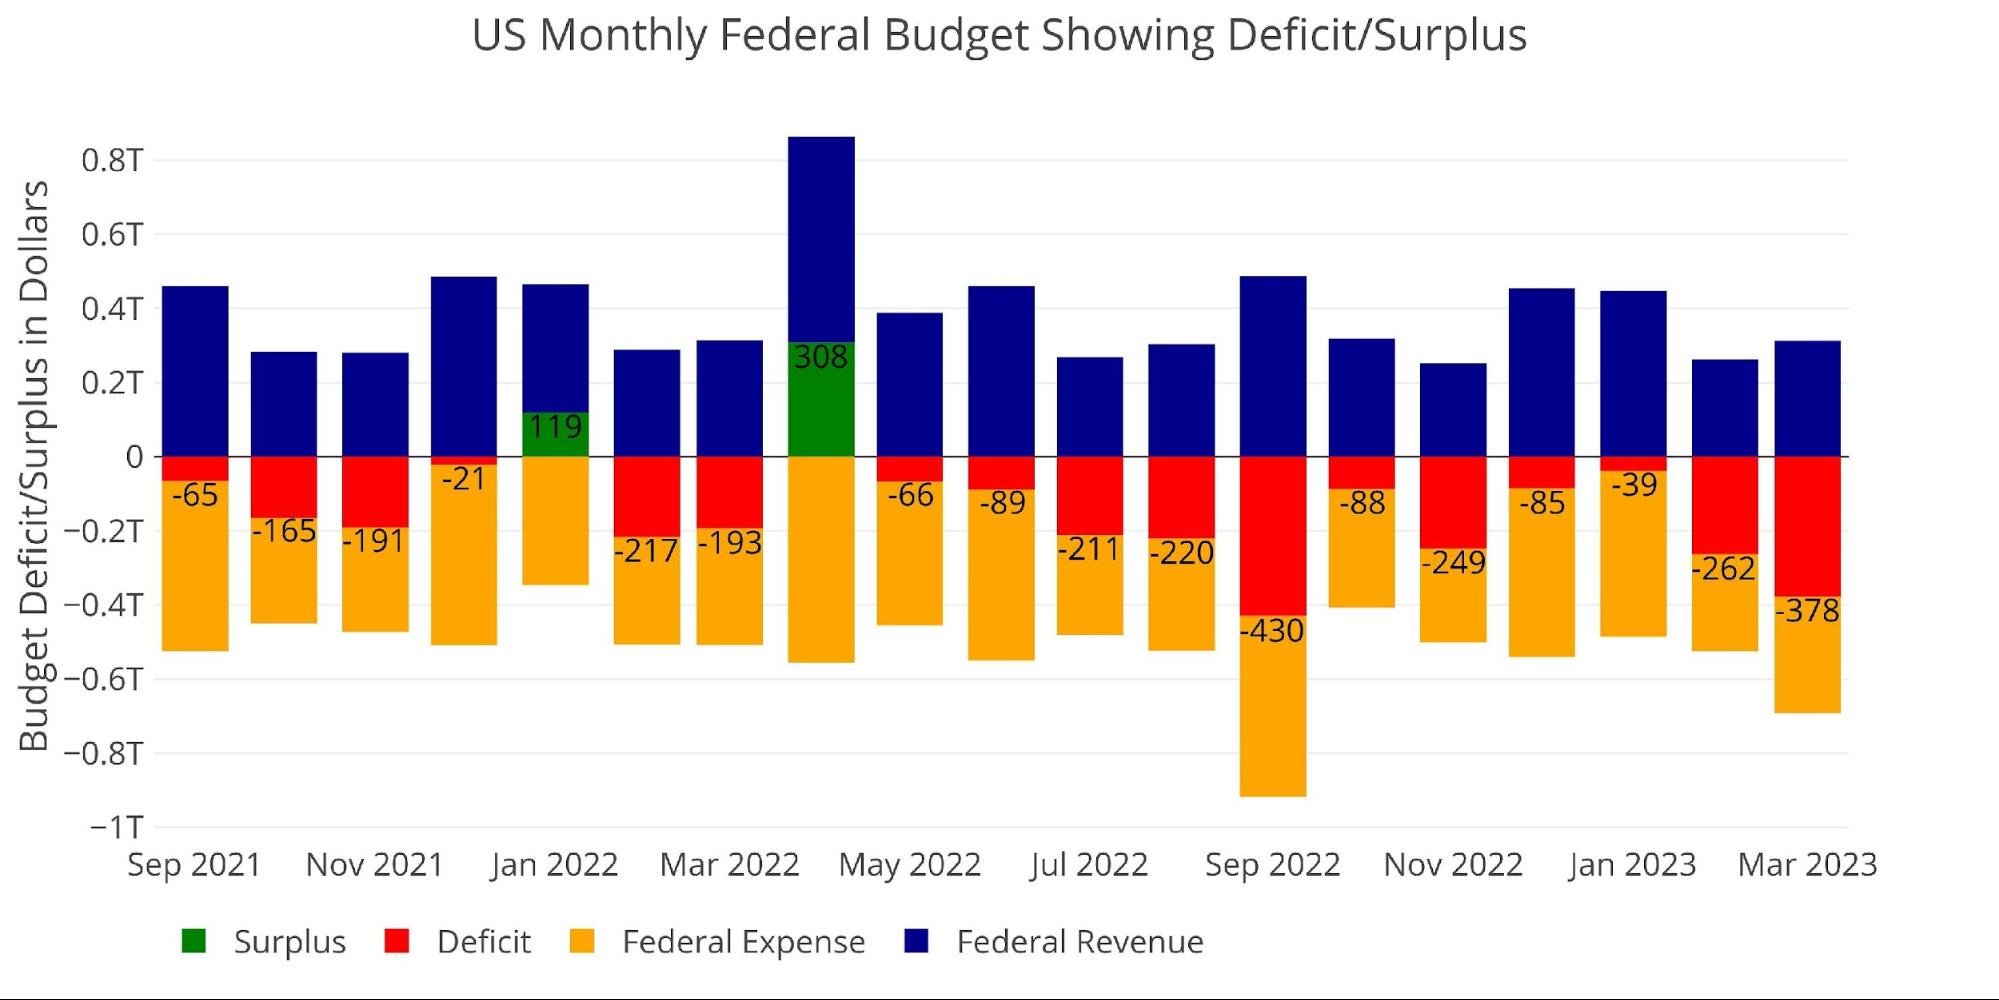
Figure: 1 Monthly Federal Budget
The chart below shows the month of March historically. This March is almost double the size of all past March deficits except for 2021 as noted above.
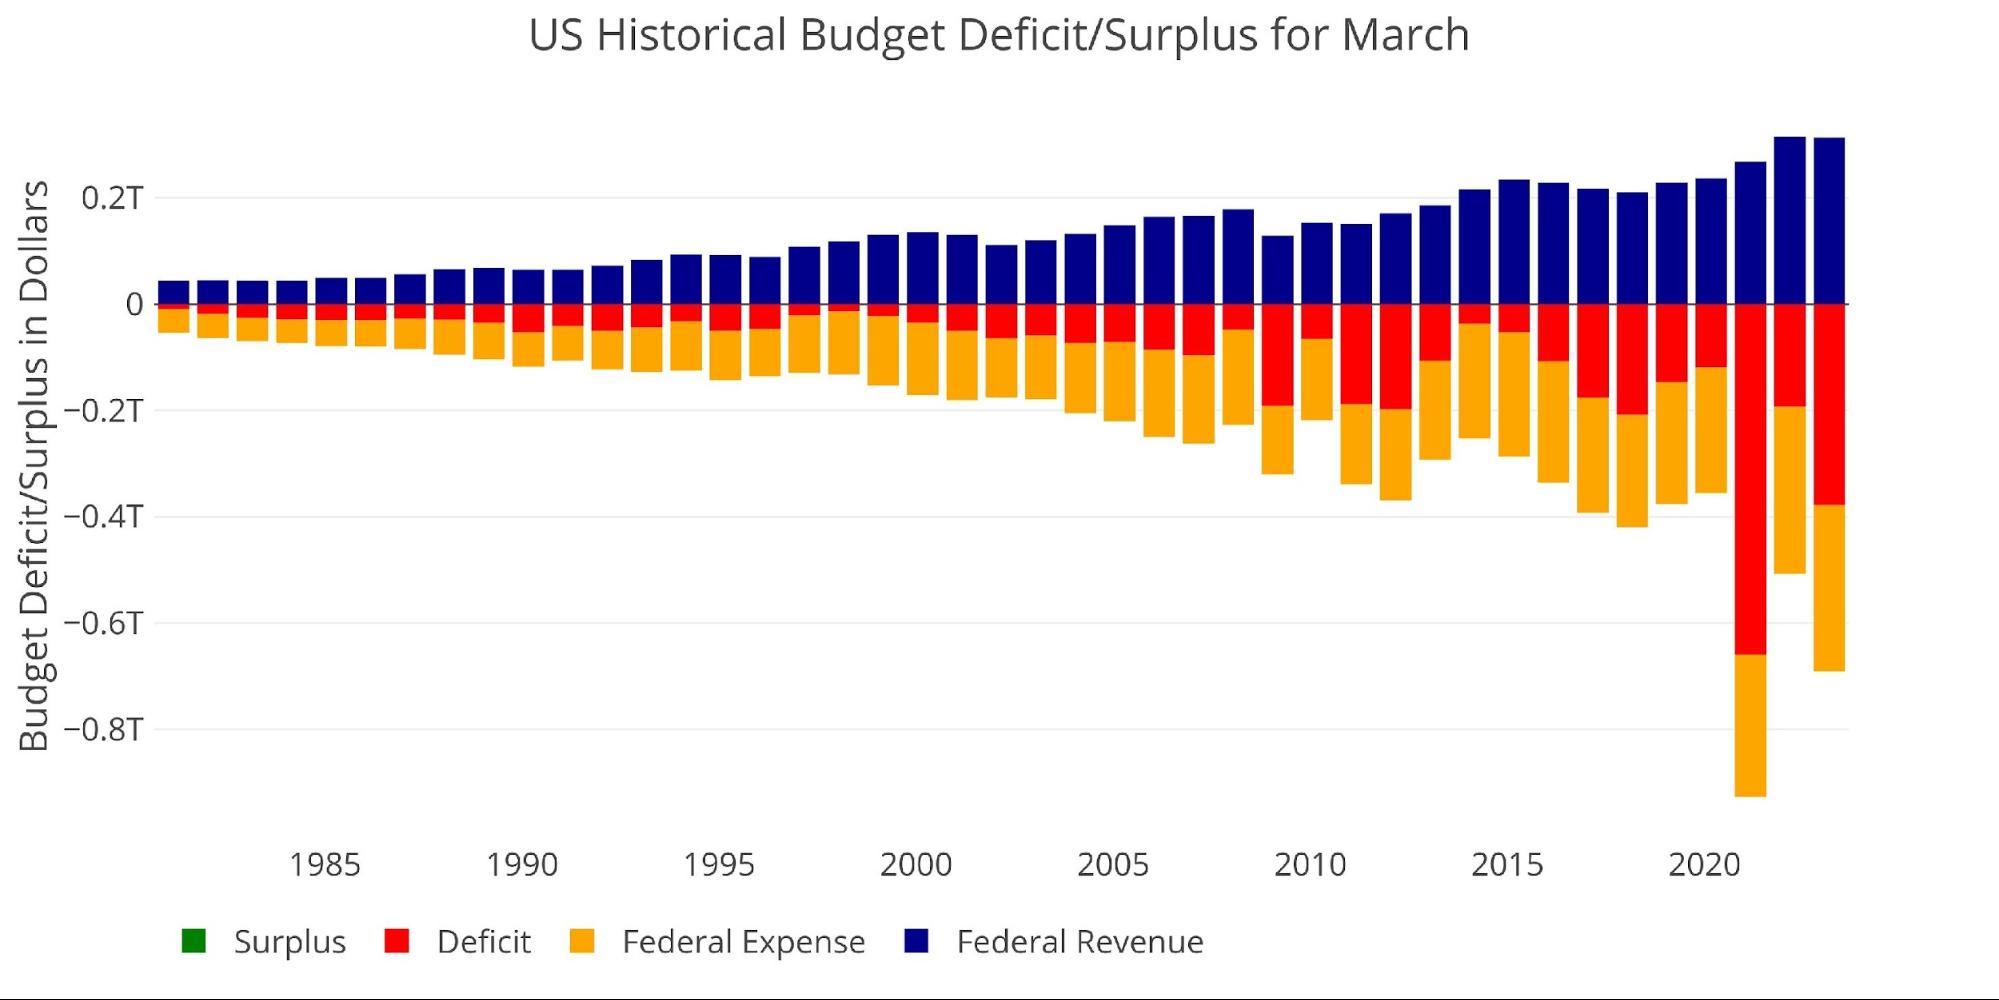
Figure: 2 Historical Deficit/Surplus for March
Looking over the ten years before Covid, this March was three times bigger than the average March deficit over that time period.

Figure: 3 Current vs Historical
The Sankey diagram below shows the distribution of spending and revenue. The Deficit represented almost 55% of total spending.
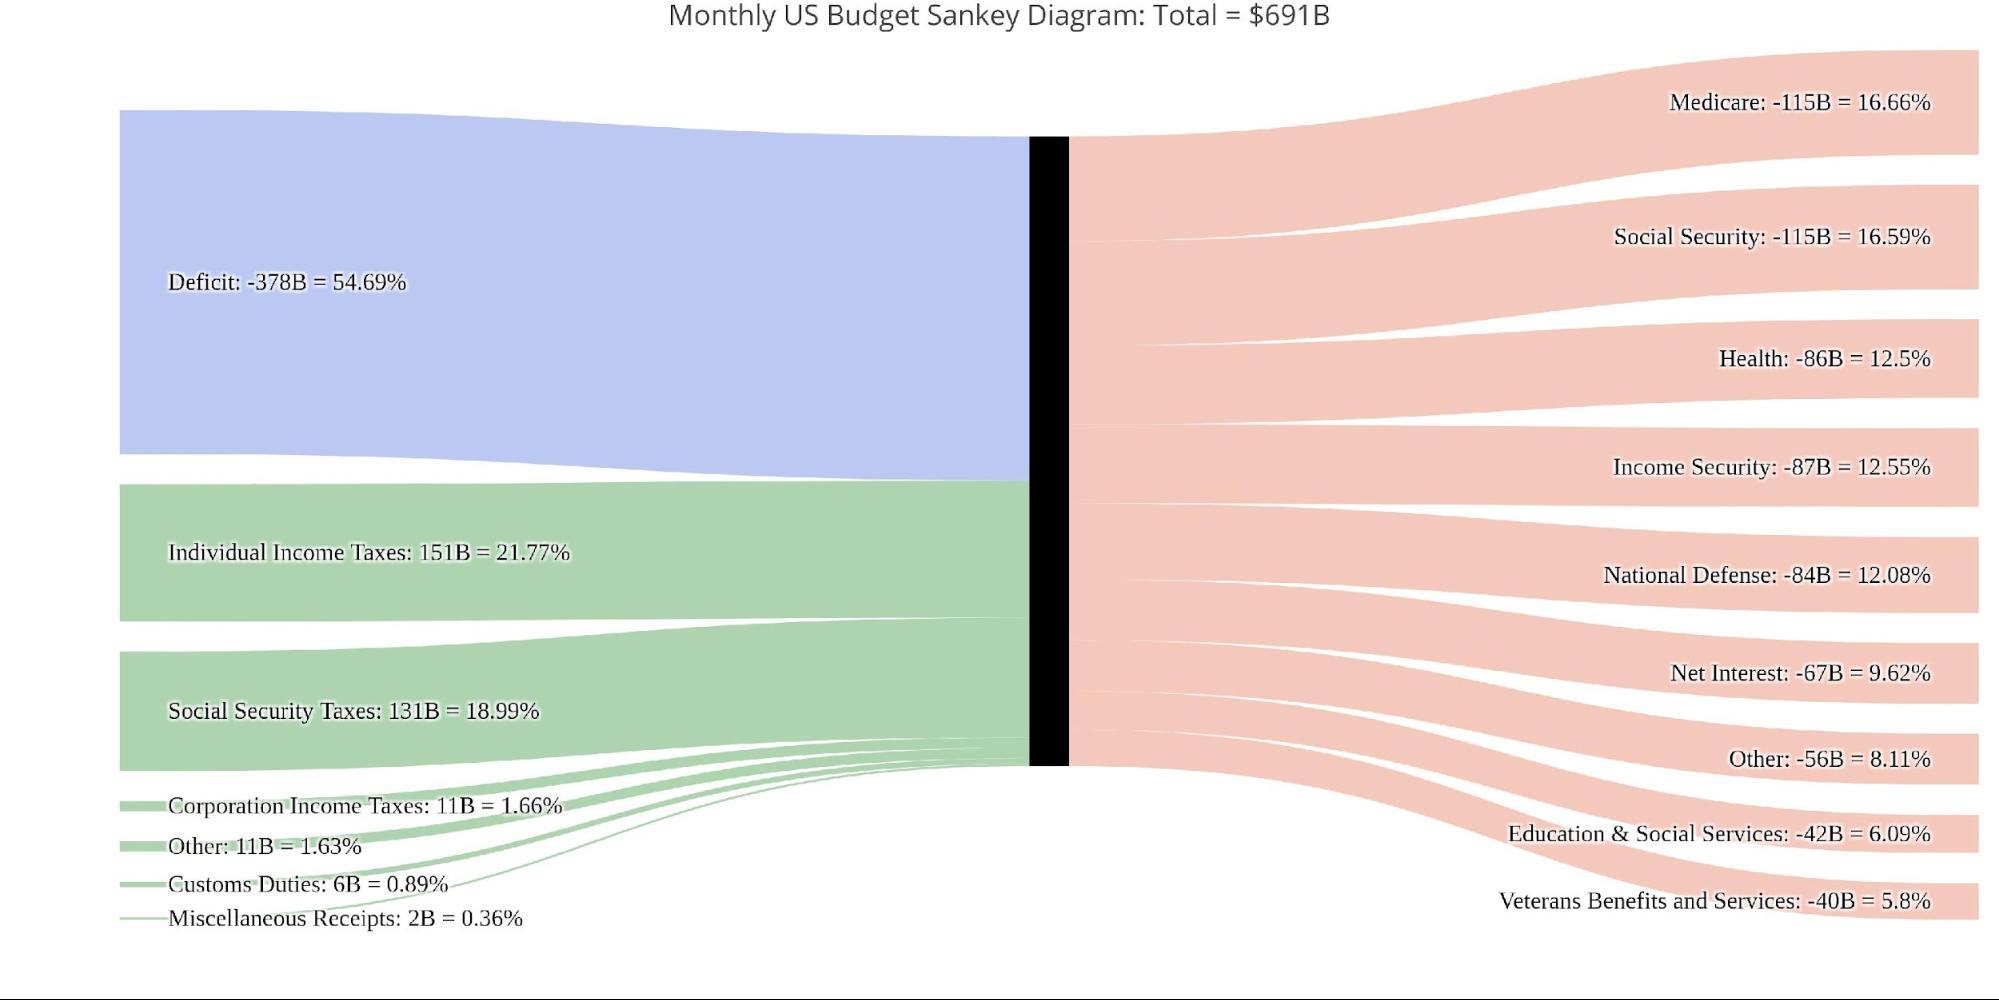
Figure: 4 Monthly Federal Budget Sankey
Looking at the TTM, the monthly deficit was two times larger than the deficit over the last year on a relative basis (55% v 27%)!
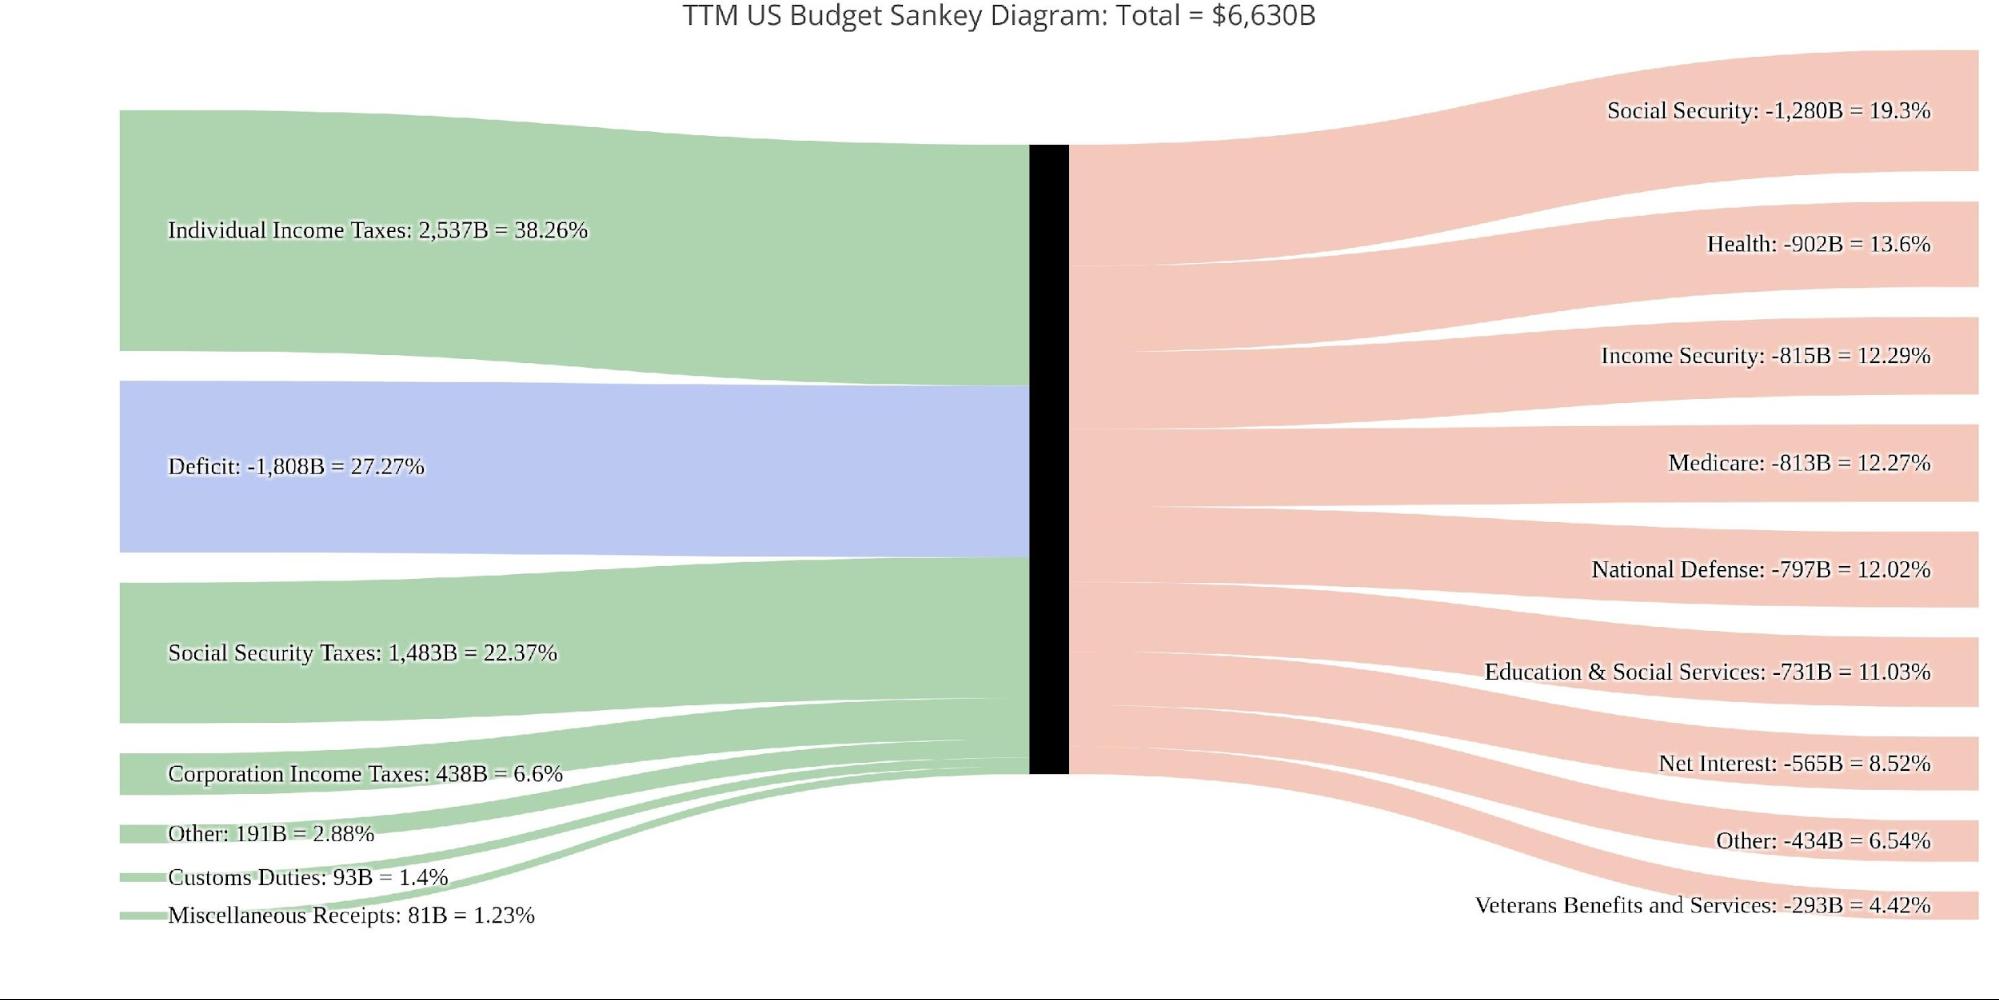
Figure: 5 TTM Federal Budget Sankey
Looking at the revenue side, this month is down from the recent peak in December due to a fall in Corporate Taxes (which is generally volatile), and a drop in Individual Income taxes. Still, the revenue this March was larger than February and larger than March 2022 and March 2021. This indicates that revenue for this March was not abnormally low, suggesting the real driver behind the large deficit was on the spending side.
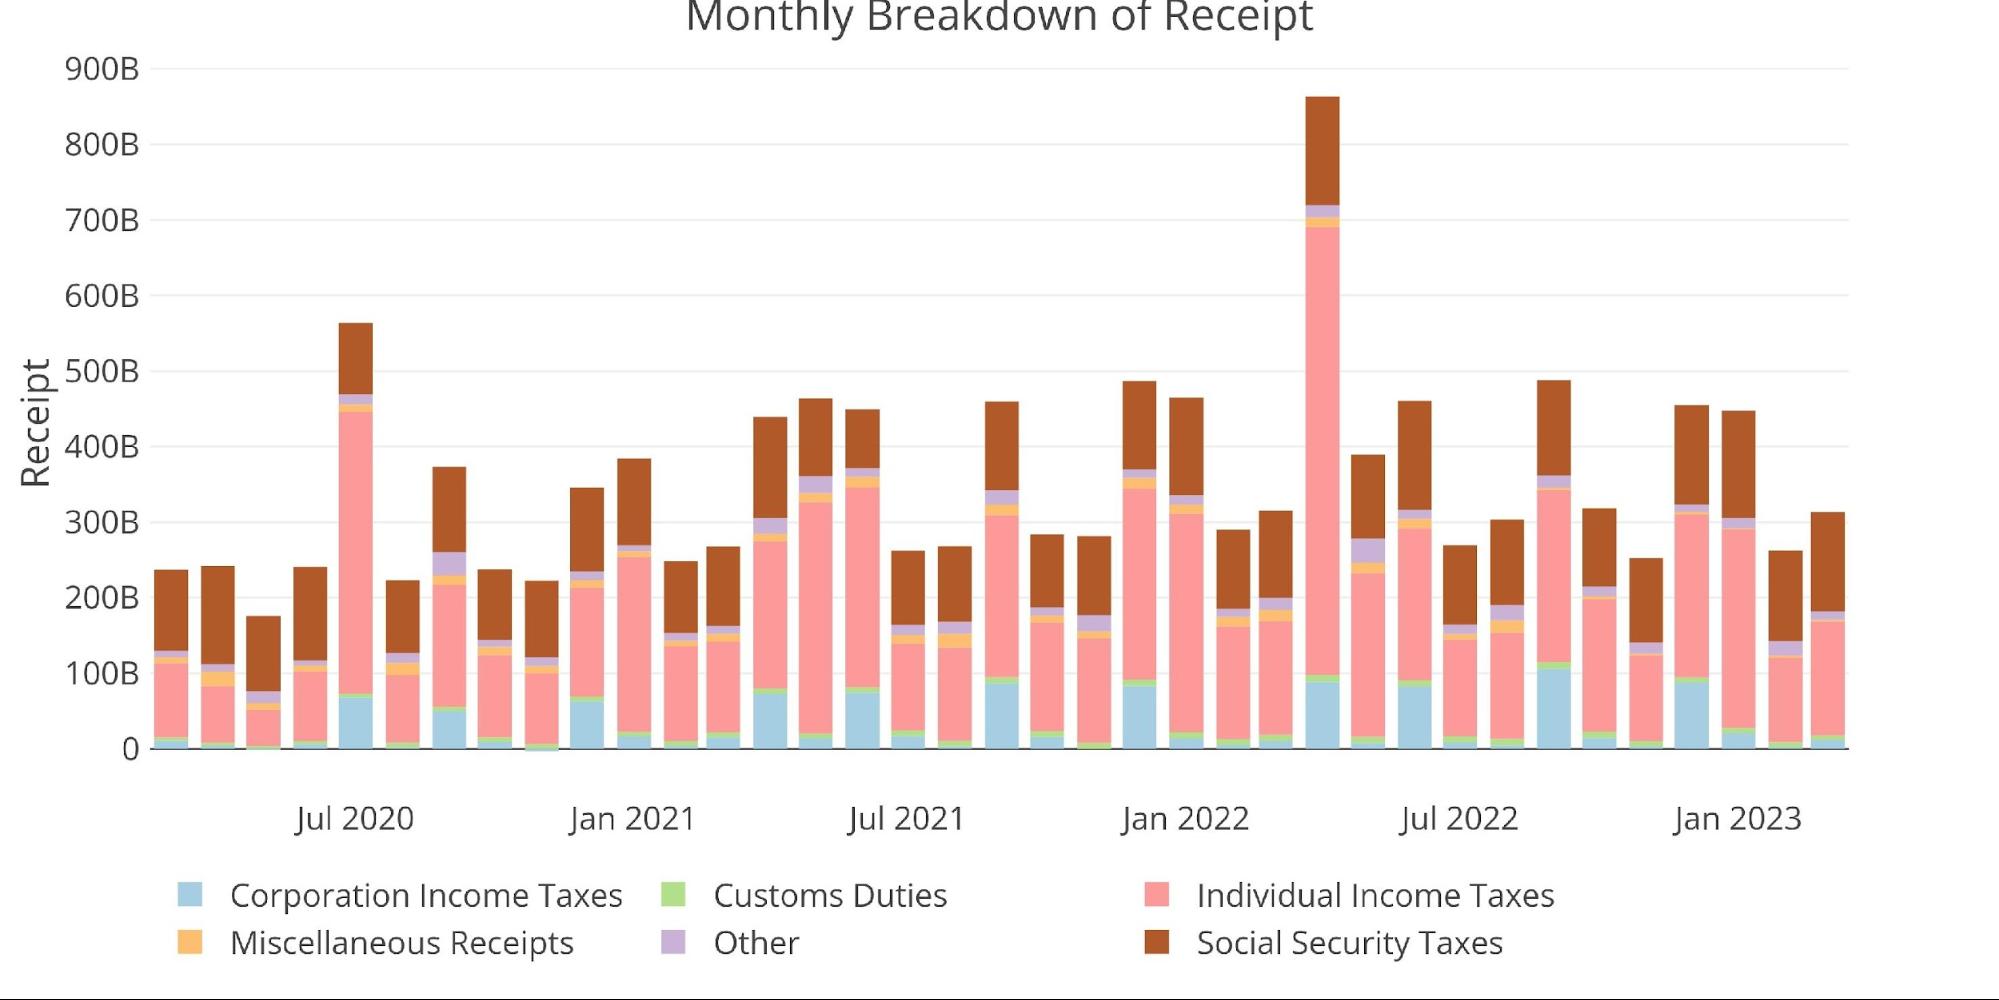
Figure: 6 Monthly Receipts
Expenses saw increases across most categories. Again, aside from September 2022, this month was the biggest expenditure month since March 2021.
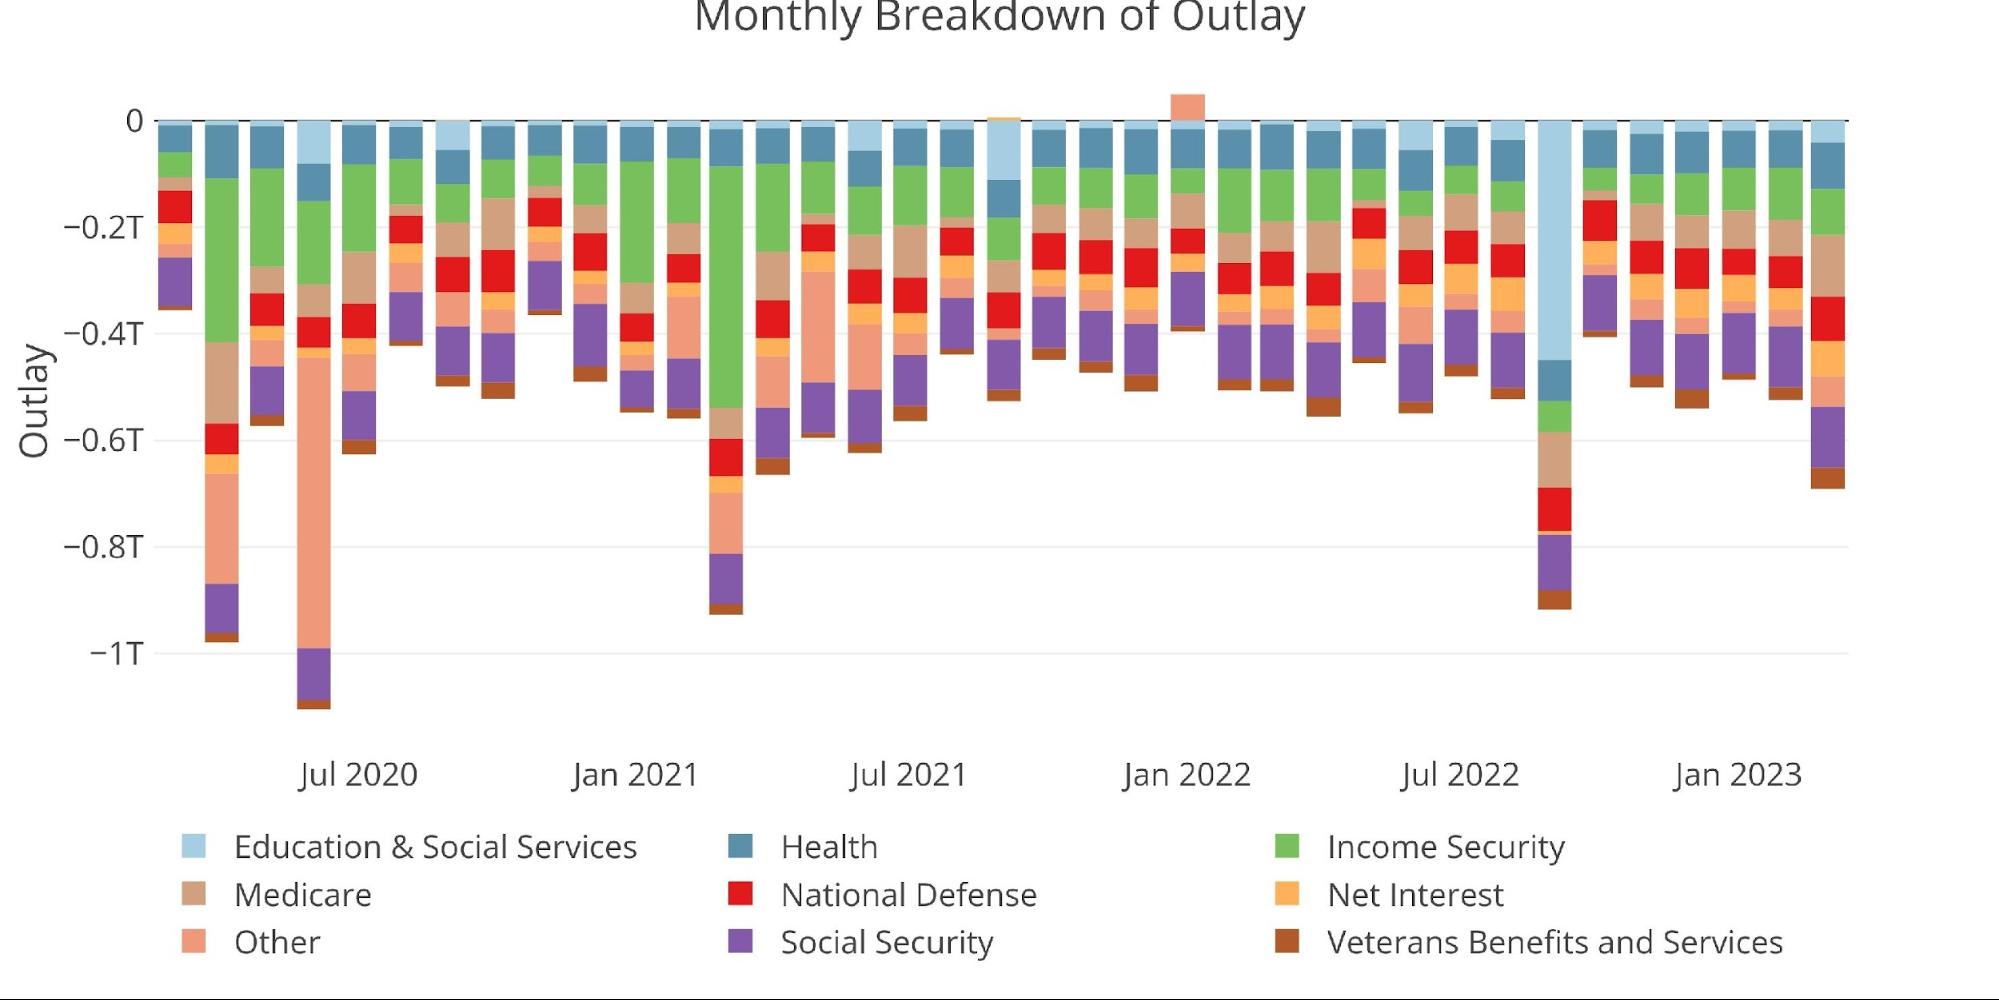
Figure: 7 Monthly Outlays
While many categories were up, it’s impossible to ignore the elephant in the room… Net Interest Expense. The chart below shows the trajectory of the TTM Net Interest. In the latest month, it rose $23B and has reached $564B! This is a completely unsustainable trajectory.
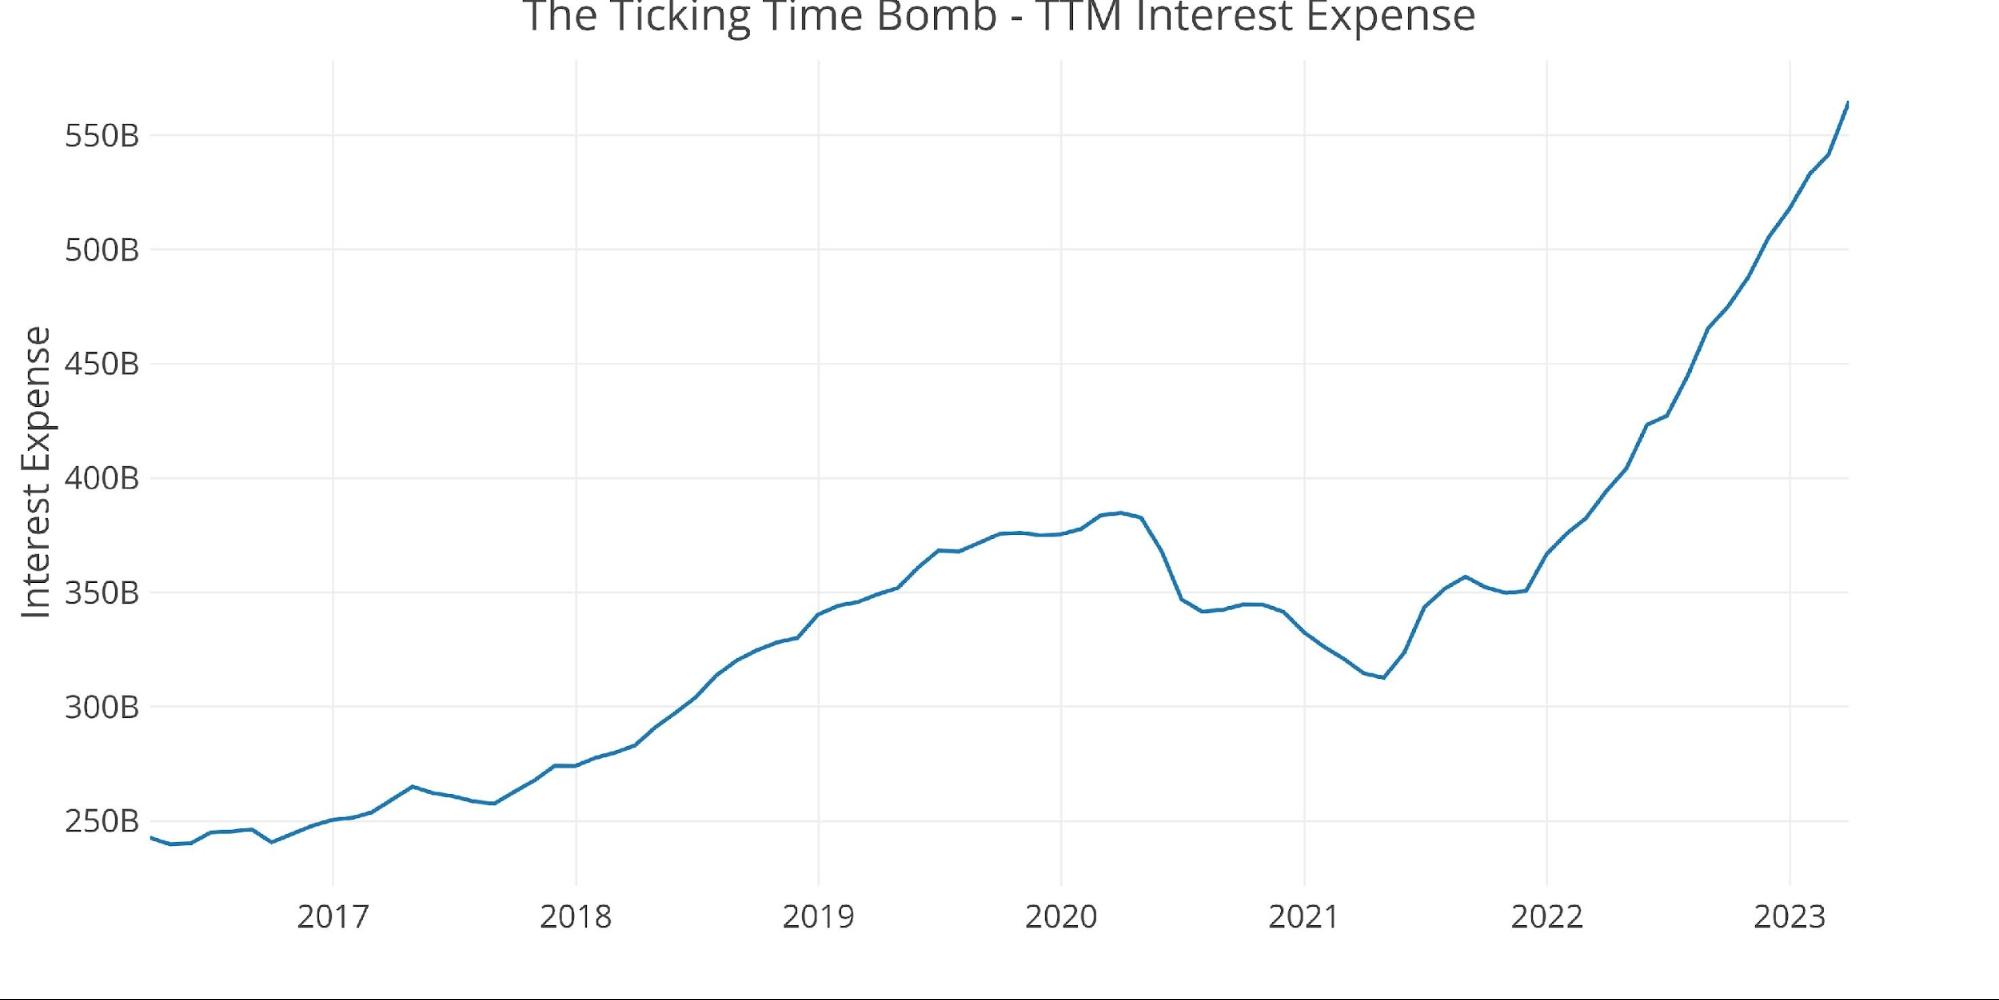
Figure: 8 TTM Interest Expense
The table below goes deeper into the numbers of each category. The key takeaways from the charts and table:
Outlays
-
- Spending was up significantly across the board. All but 1 category were up YoY, with 7 categories up over 10% YoY and 5 categories up greater than 50%!
-
- Compared to the TTM Average, 6 categories were up more than 25%
-
- On a TTM basis, Net Interest Expense is up 43%, and up almost 80% since March 2021!
- Also looking at TTM, only 2 categories saw reductions and both are related to stimulus spending: Income Security and Other (Stimulus checks)
- Spending was up significantly across the board. All but 1 category were up YoY, with 7 categories up over 10% YoY and 5 categories up greater than 50%!
Receipts
-
- Individual Income Taxes were flat YoY but below the 12-month average by 29%
- Social Security and Corporate Income Taxes were up over 10% YoY
- On a TTM basis – all categories except Miscellaneous Receipts (the smallest category) were positive
Total
-
- Total Outlays of $691B exceeded last March by 36% and was larger than the 12-month average by 25%
- Receipts fell slightly YoY and was 22% below the 12-month average
- The total deficit was 151% larger than the 12-month average
As the current recession becomes deeper and more obvious, recent predictions made at SchiffGold will come true. Specifically, a drop in revenue and an increase in expenses. This has already started to happen before the current recession is officially recognized. With the Fed now forecasting a mild recession, it should become obvious that March was just the tip of the iceberg. This problem is going to get a whole lot worse.
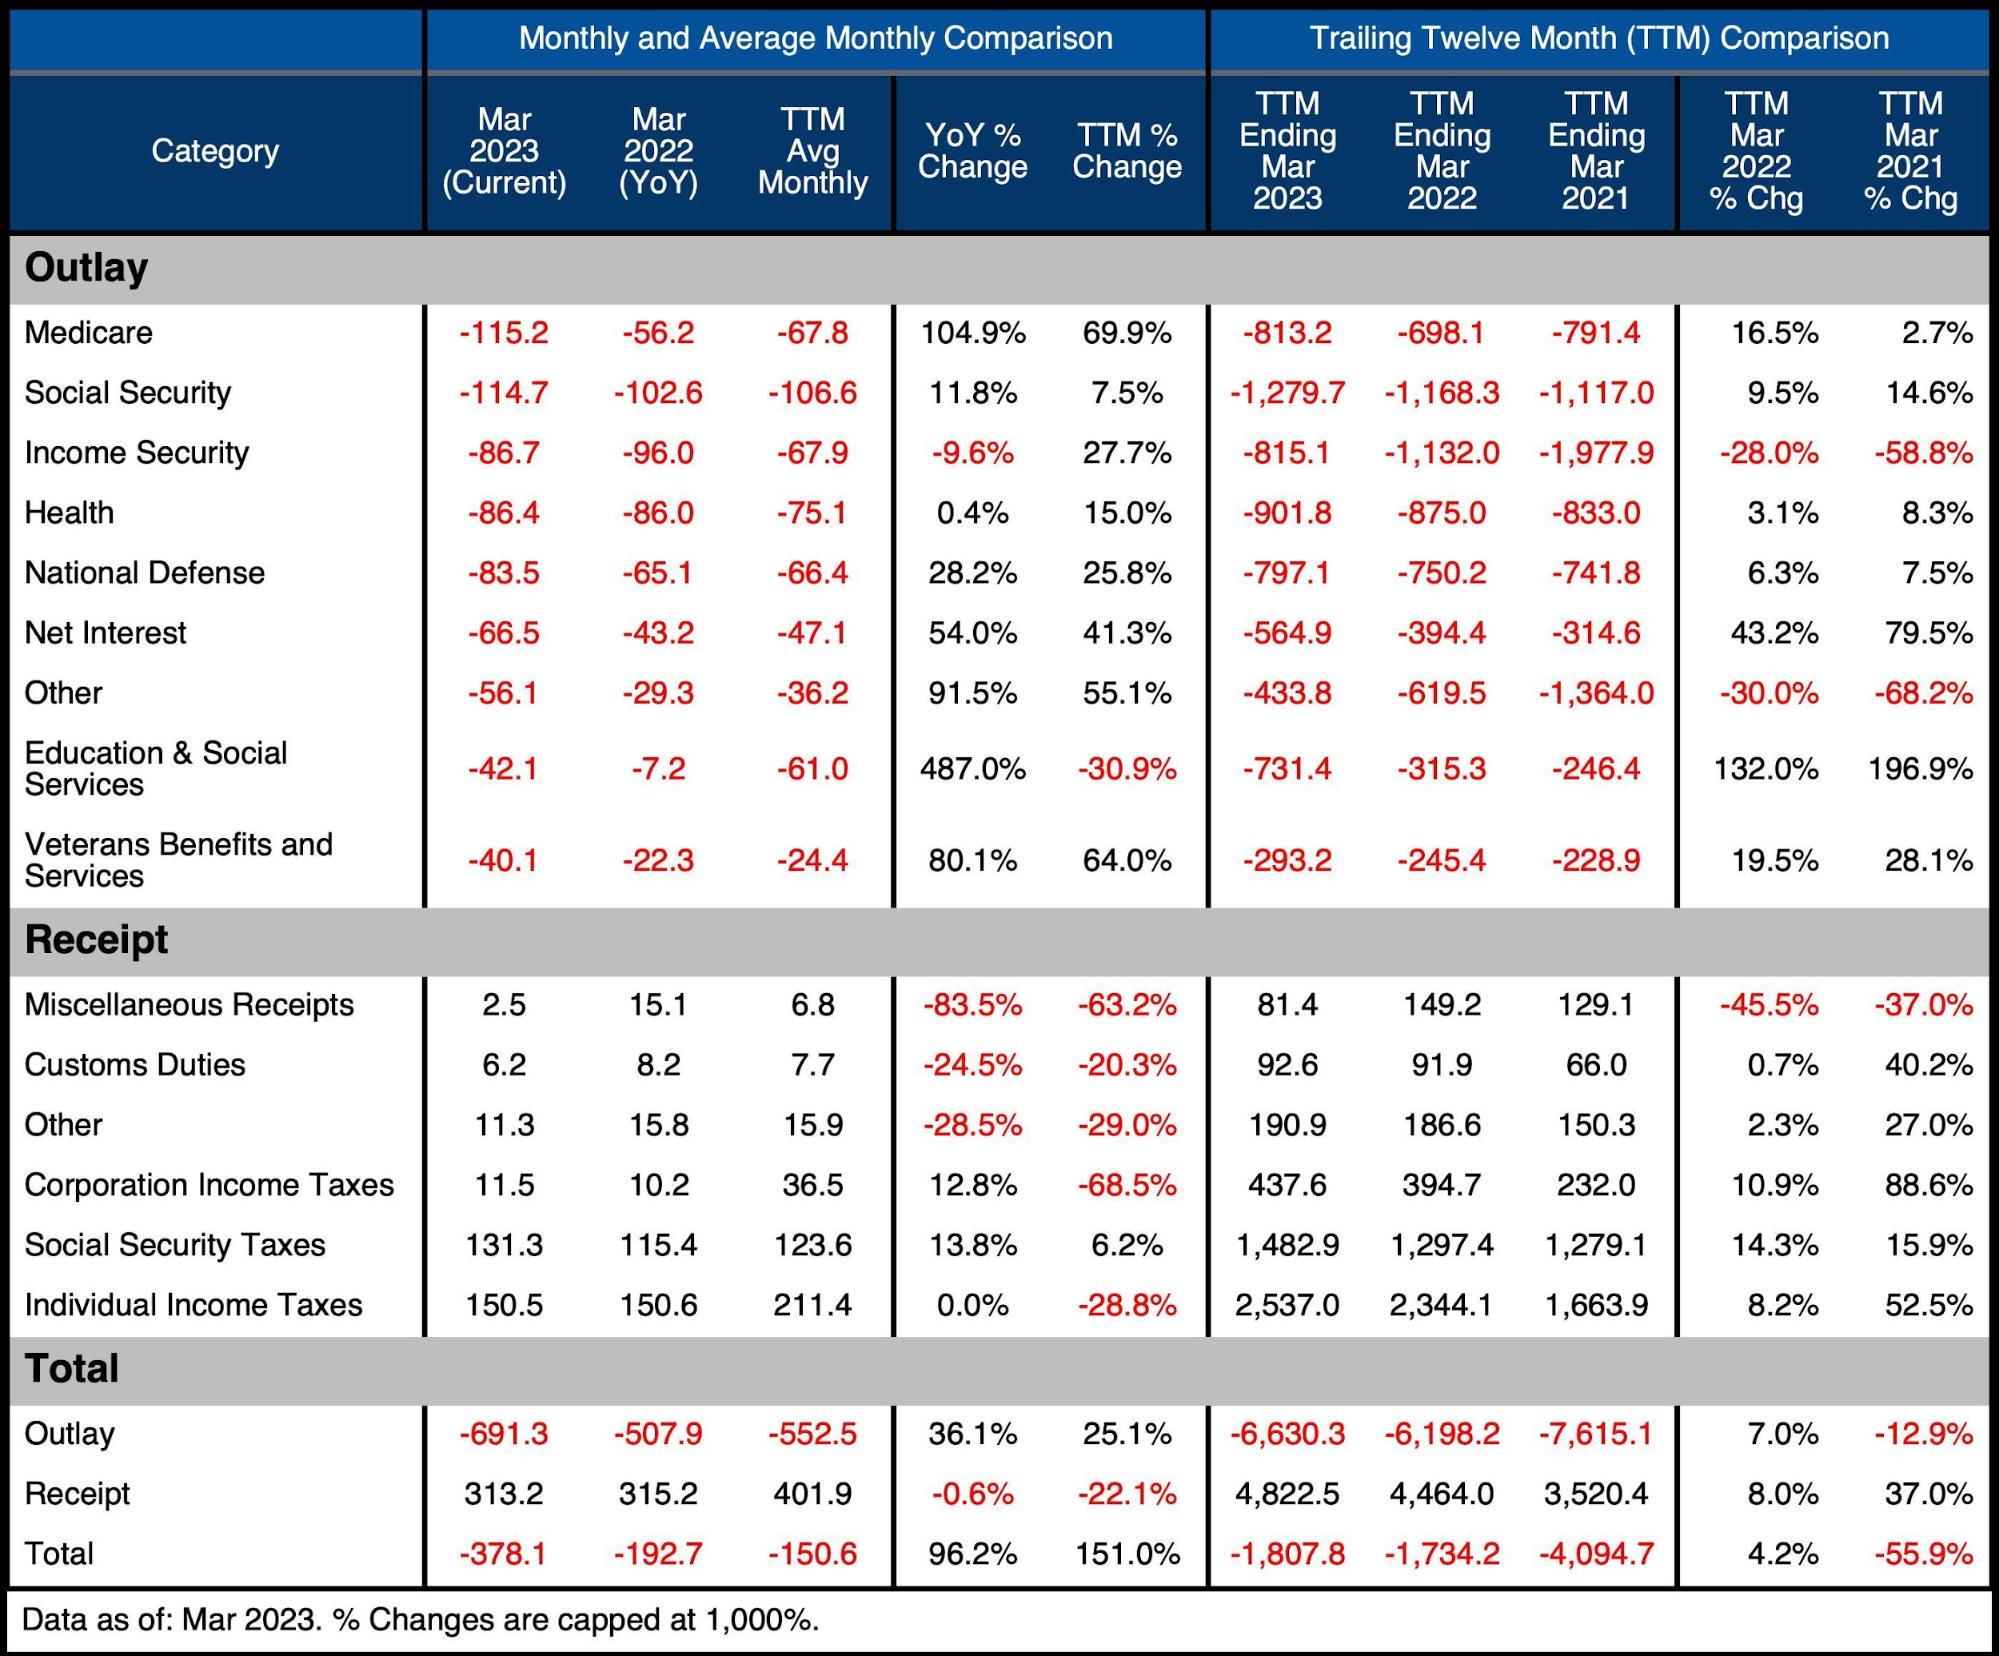
Figure: 9 US Budget Detail
Historical Perspective
Zooming out and looking over the history of the budget back to 1980 shows a complete picture. Both spending and revenue saw a big jump right at the beginning of Covid. Spending saw a retrenchment but has since reversed and started growing again. On the other side, revenue has now been flat for months. This means that the recent tax windfalls that helped buffer the increase in spending have now waned.
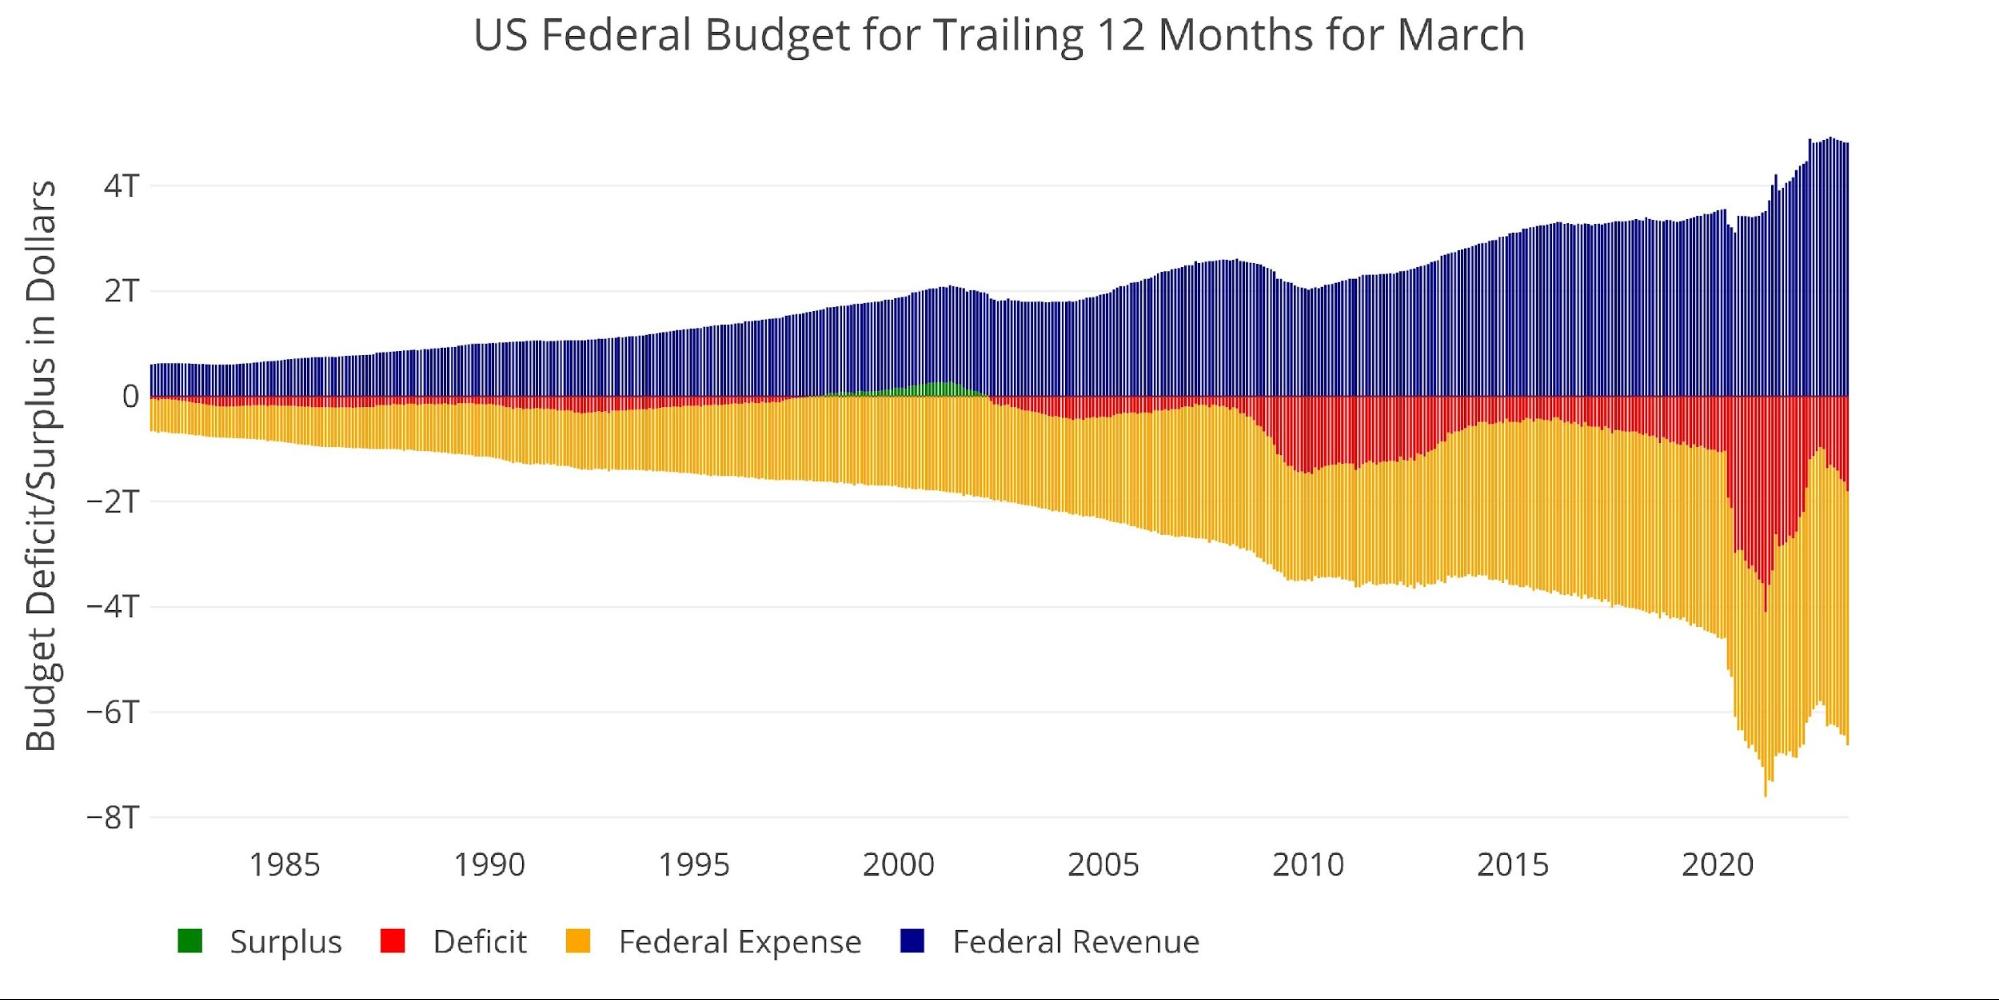
Figure: 10 Trailing 12 Months (TTM)
The next two charts zoom in on the recent periods to show the change when compared to pre-Covid.
As shown below, total Receipts have surged higher in the last two years driven by Social Security, Corporate Taxes, and Individual Taxes. In two years, total revenue has climbed by $1.3T.
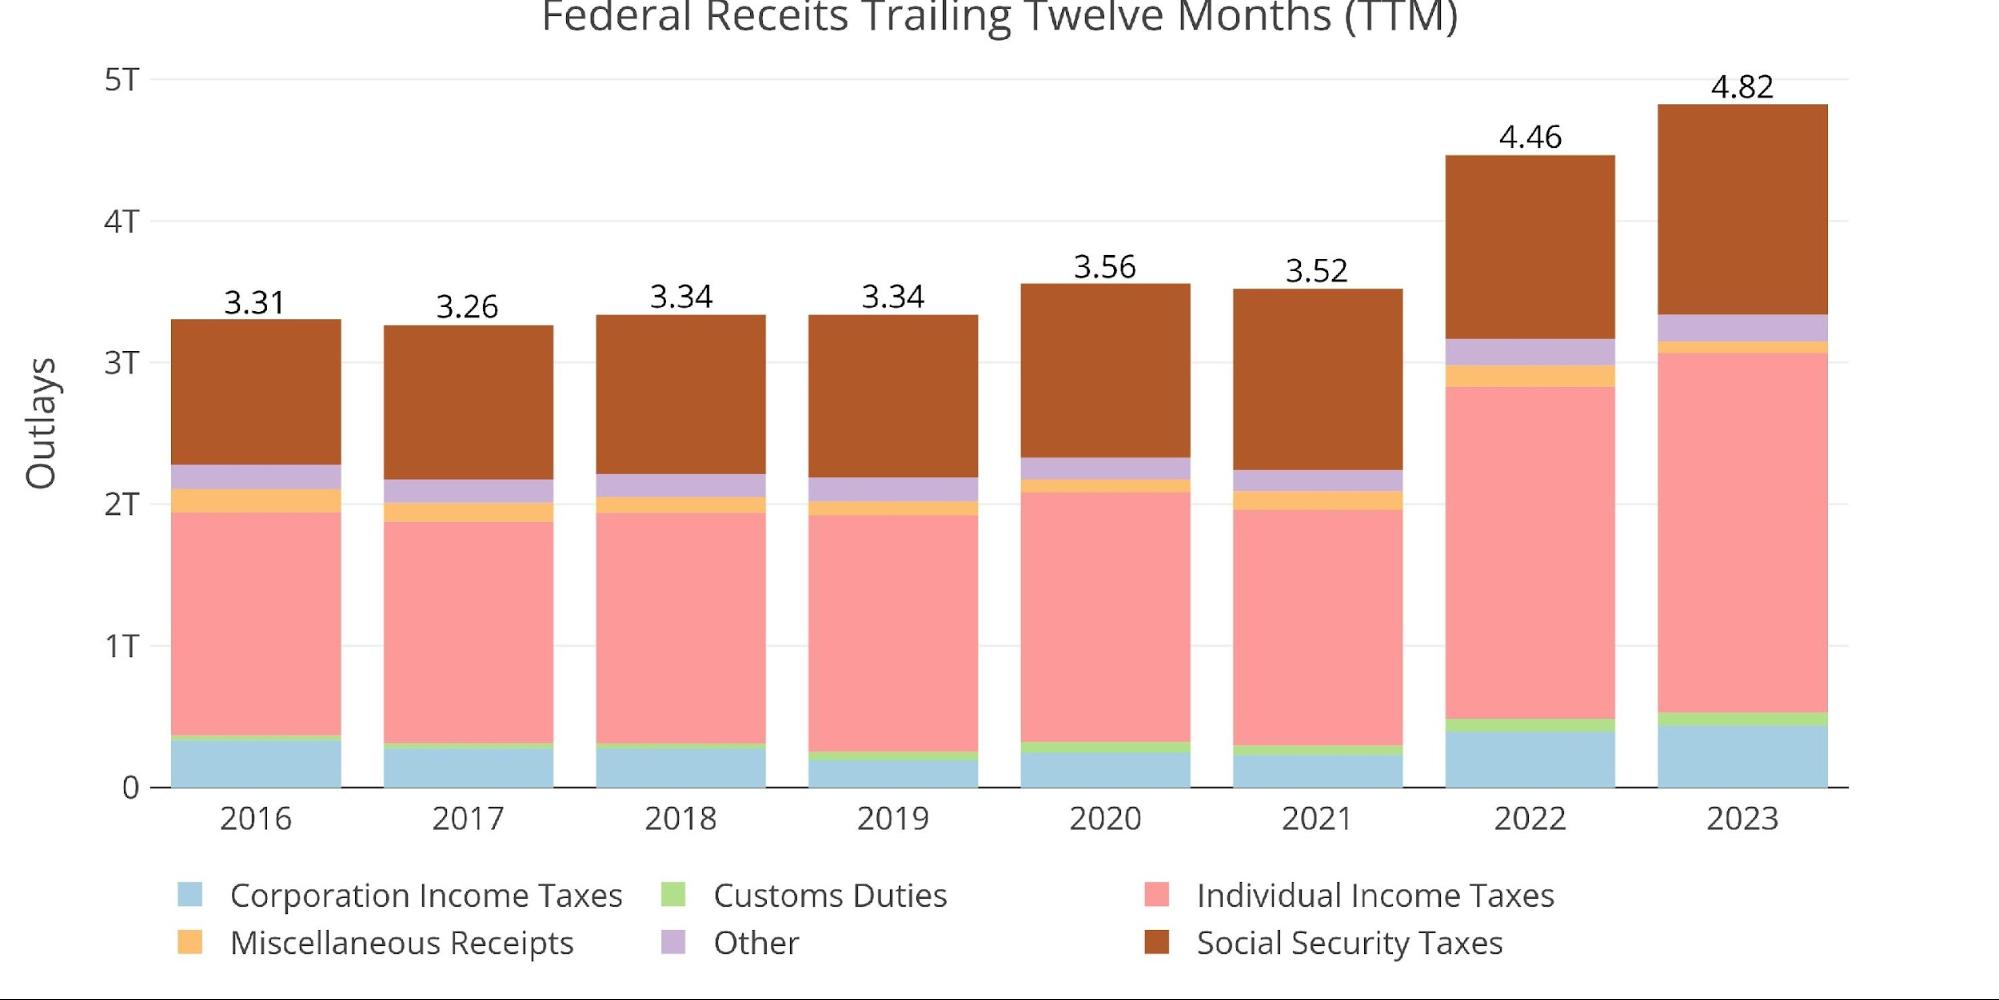
Figure: 11 Annual Federal Receipts
Spending has also seen a massive surge, blasting well past $6T per year for the last three years. The biggest concern is the increase in spending YoY. This means that the government is now at a new spending level that is $1.8T larger than receipts over the same time period.

Figure: 12 Annual Federal Expenses
One other potential risk to the Federal budget in the near future is when Social Security goes from cash flow positive to negative. As of now, collected taxes still exceed paid benefits, but that could change as the baby boomer generation continues to retire. It should also be noted, that the increase in revenue over the years has become a major burden on middle-income families who see an ever larger portion of their income subject to the 6.2% tax.
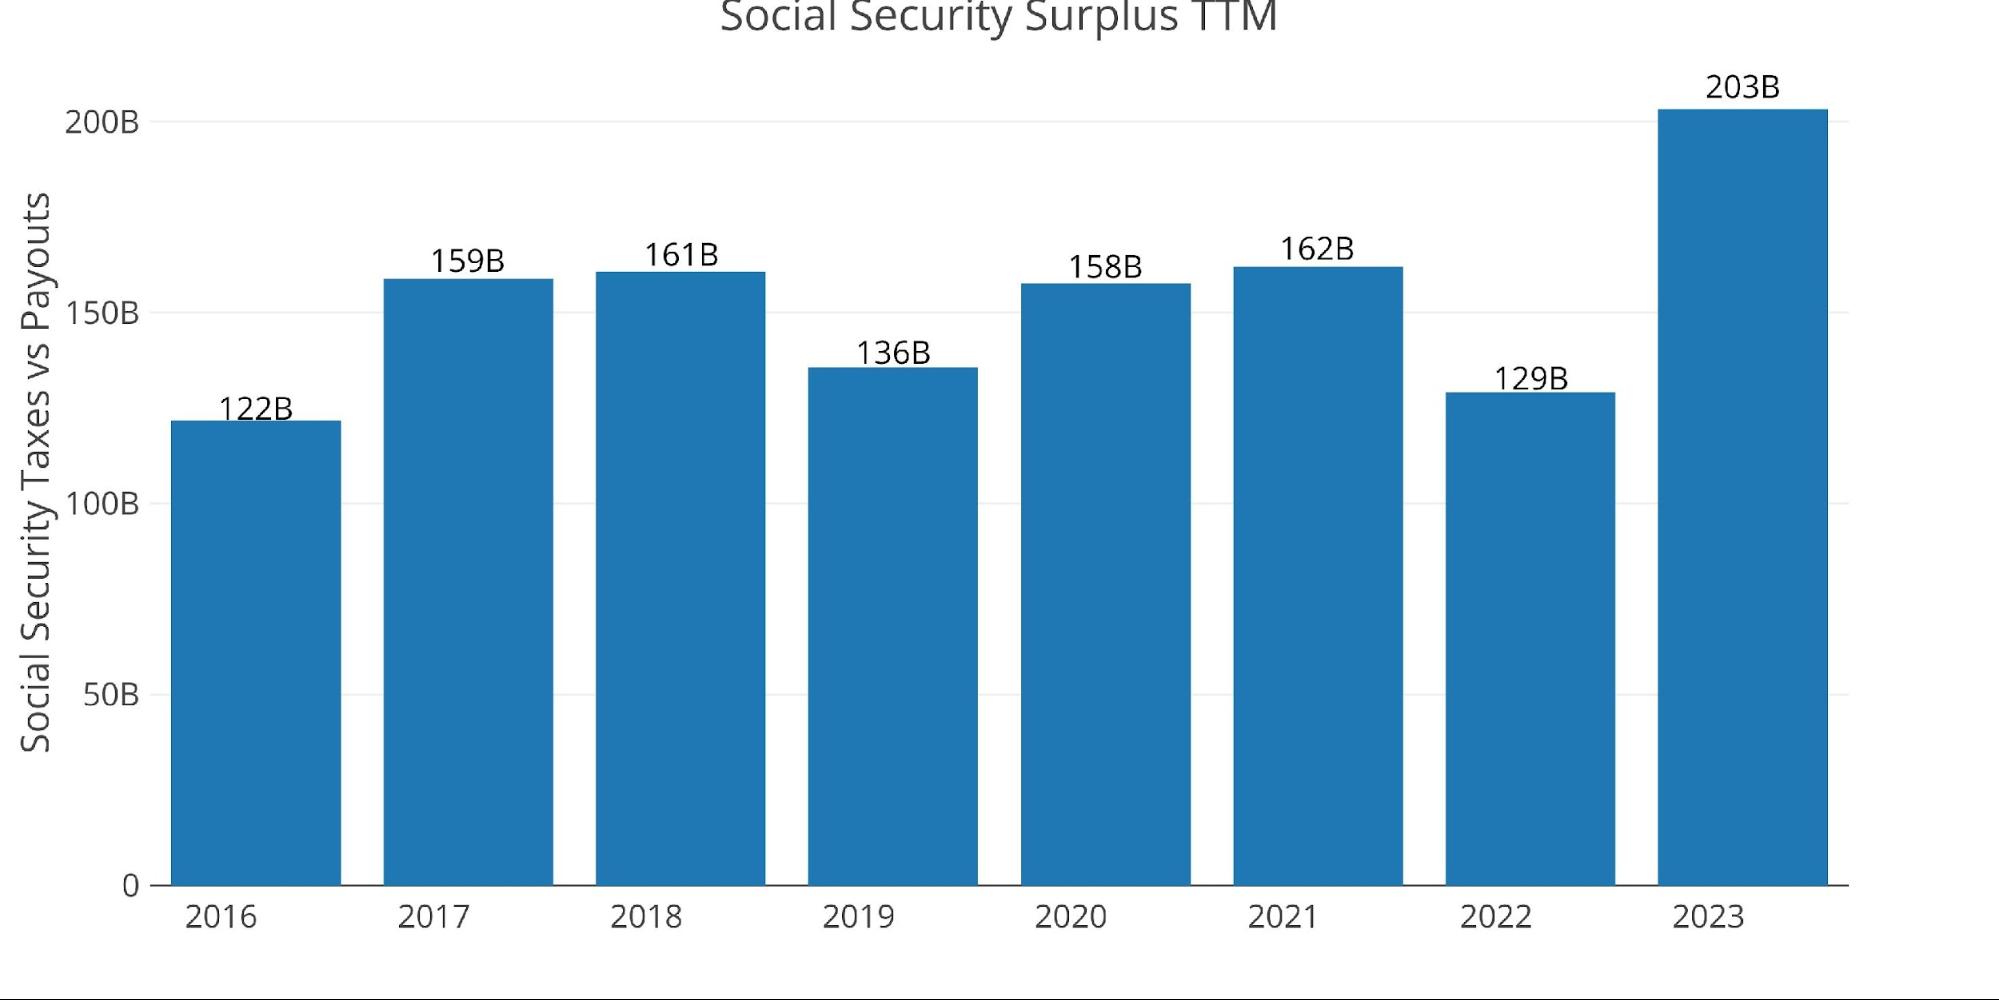
Figure: 13 Social Security
The view below shows the deficit as a percentage of GDP. As seen, the deficit spiked in response to Covid, retraced, but is now heading back up. The relative deficit is still below the 2009 level, but the 10% in 2009 was amid the Great Recession. We are now at 7% and the true impact of the current recession has not even started to be felt. In the years ahead, we may break the 18.4% record seen in March 2021.
Note: GDP Axis is set to log scale
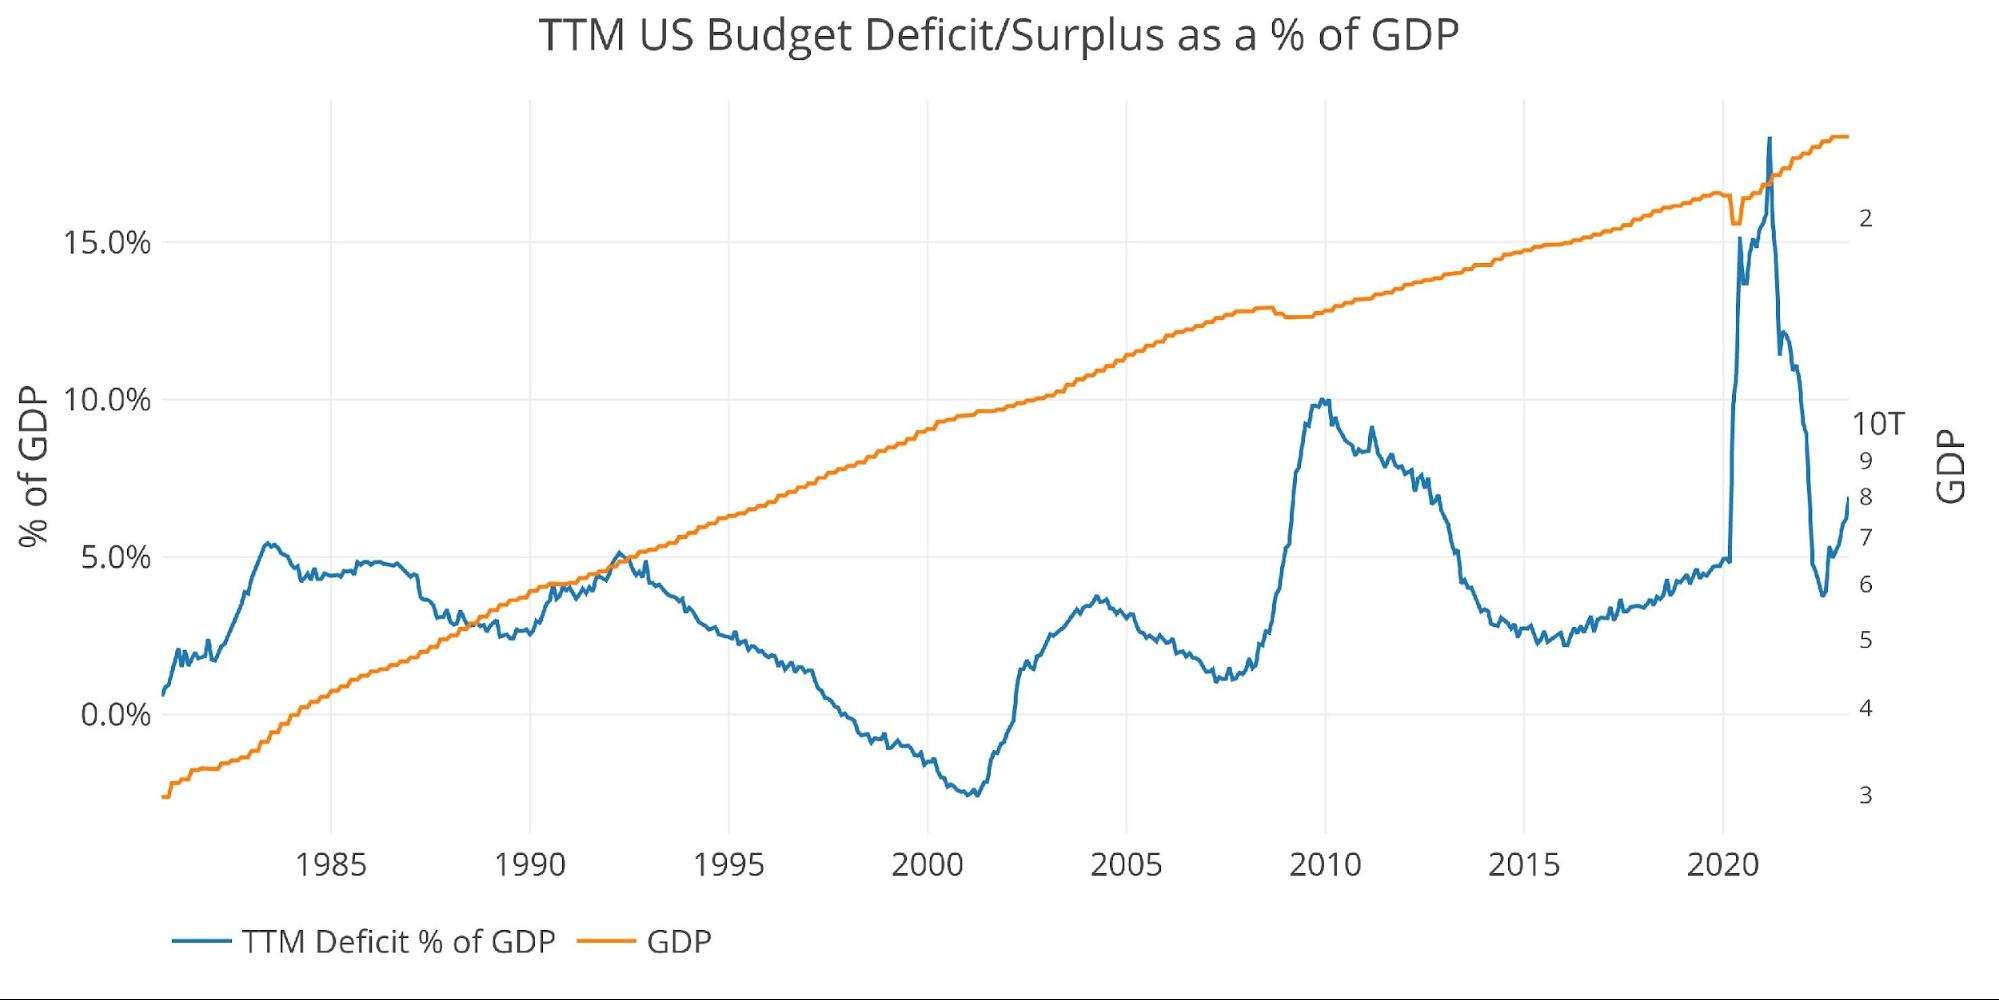
Figure: 14 TTM vs GDP
Finally, to compare the calendar year with previous calendar years (not fiscal budget years), the plot below shows the YTD numbers historically. The current year trails only 2021 which included the Biden stimulus package.
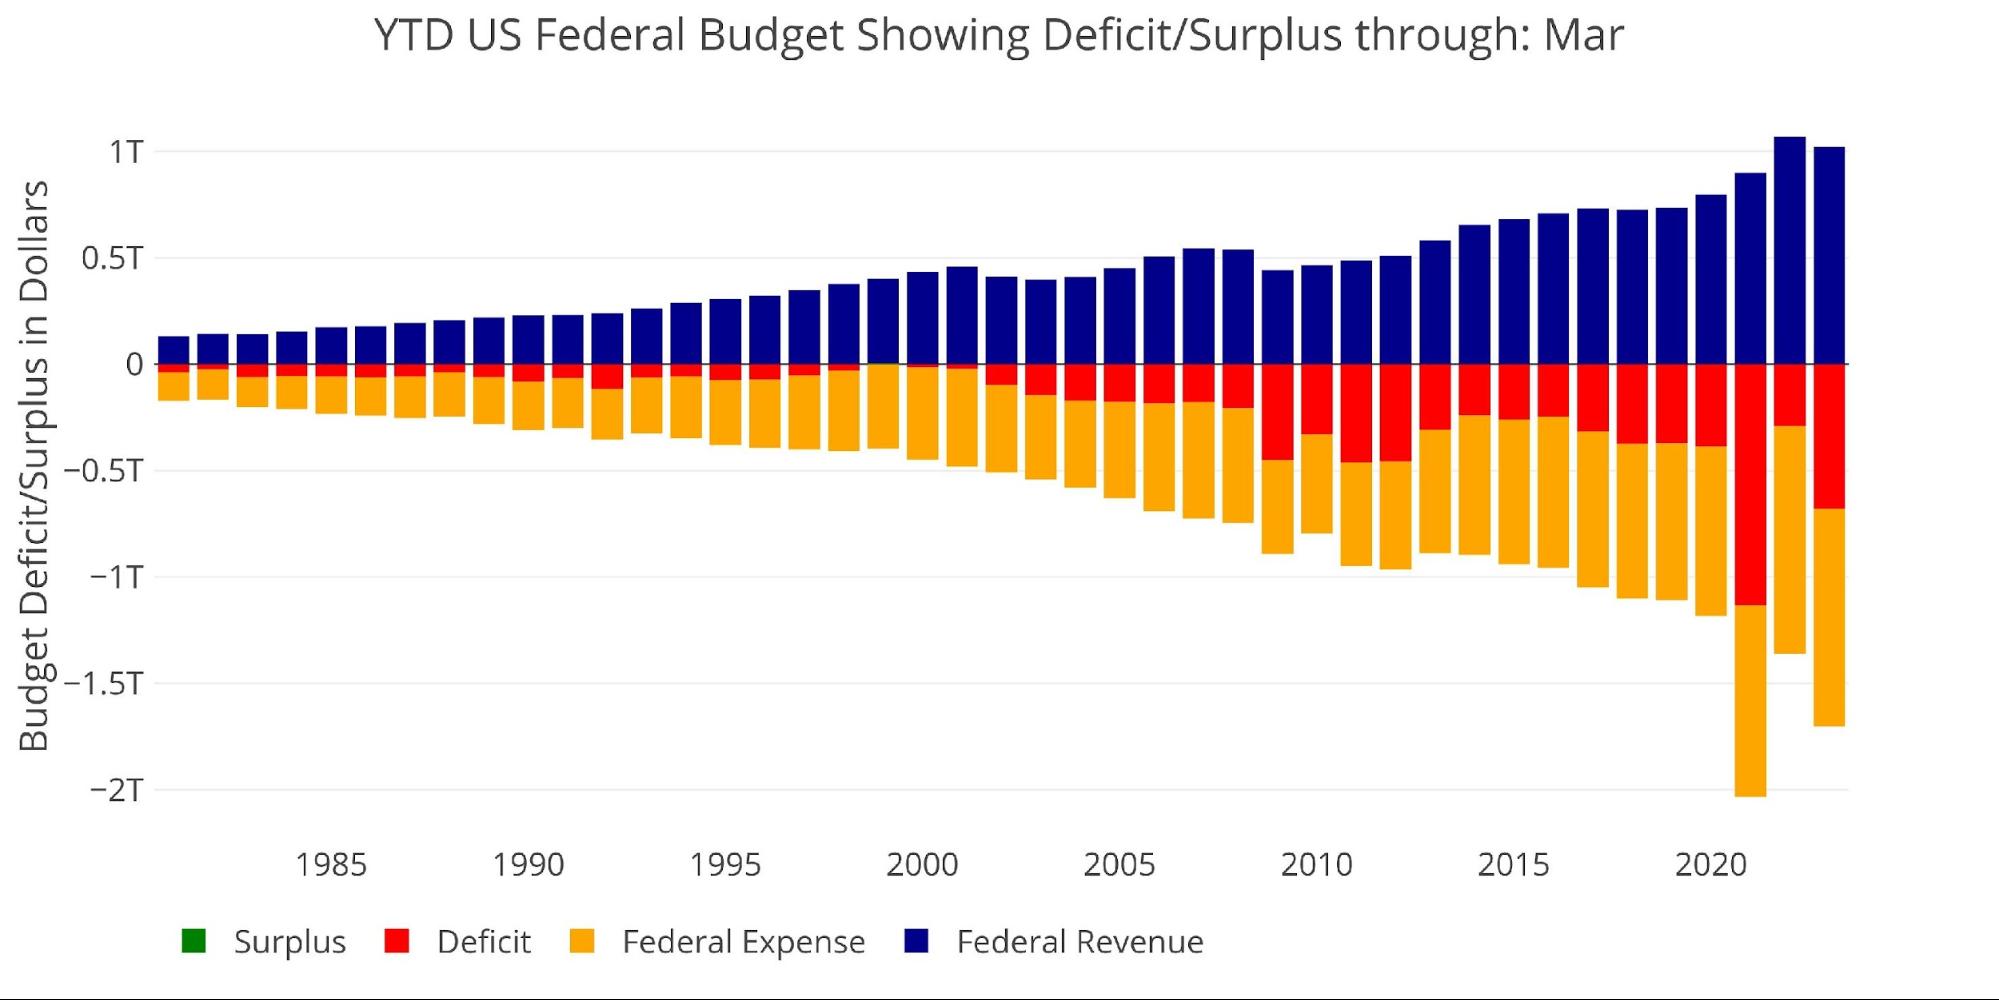
Figure: 15 Year to Date
Wrapping Up
The massive deficit this month is very concerning. Revenues were fairly normal, but spending was up across multiple categories. This is all happening before the government has to rescue the economy out of recession. The TTM deficit clocked in at $1.8T. This is completely unsustainable, especially as interest rates take their toll, pushing interest payments above $550B.
The CPI may be cooling, but it won’t get back to 2% before the Fed is forced to reverse course. The Federal government cannot stay solvent without help from the Fed. If they somehow do not know this obvious fact, it will become clearly apparent in the months ahead. The gold market seems to be front-running this realization as it closes in on all-time highs. Eventually, it will pass and then greatly exceed those all-time highs. Until then, best to load up while prices are still reasonable.
Data Source: Monthly Treasury Statement
Data Updated: Monthly on eighth business day
Last Updated: Period ending Mar 2023