The US housing market may be staging a powerful recovery – if one only goes by homebuilders record prices and certainly not the highest mortgage rates in 40 years – but it’s not because affordability is getting any better. On the contrary: according to Redfin, the typical homebuyer’s monthly mortgage payment was $2,605 during the four weeks ending July 30, up 19% from a year earlier and down just $32 from early July’s all-time high (with the 10Y blowing out, it’s just a matter of time before we hit a fresh record).
This article was originally published by Zerohedge.
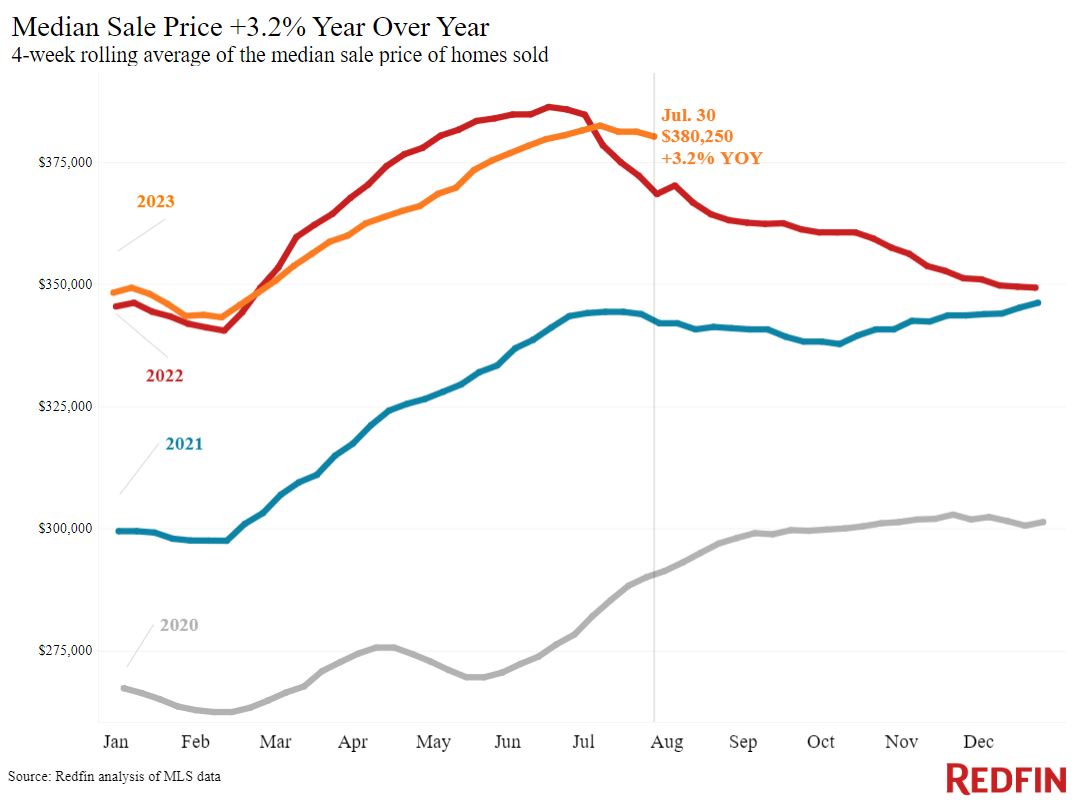
This means that housing payments remain historically high because mortgage rates remain elevated, with weekly average rates clocking in at 6.9% this week, and yet home prices continue to rise. Paradoxically, the median home-sale price is up 3.2% year over year, the biggest increase since November.
Needless to say, the renewed rise in prices are not due to the increase in mortgage rates but largely due to the persistent lack of supply…
… with inventory posting its biggest drop in 18 months as homeowners grasp onto low rates. Here’s Redfin:
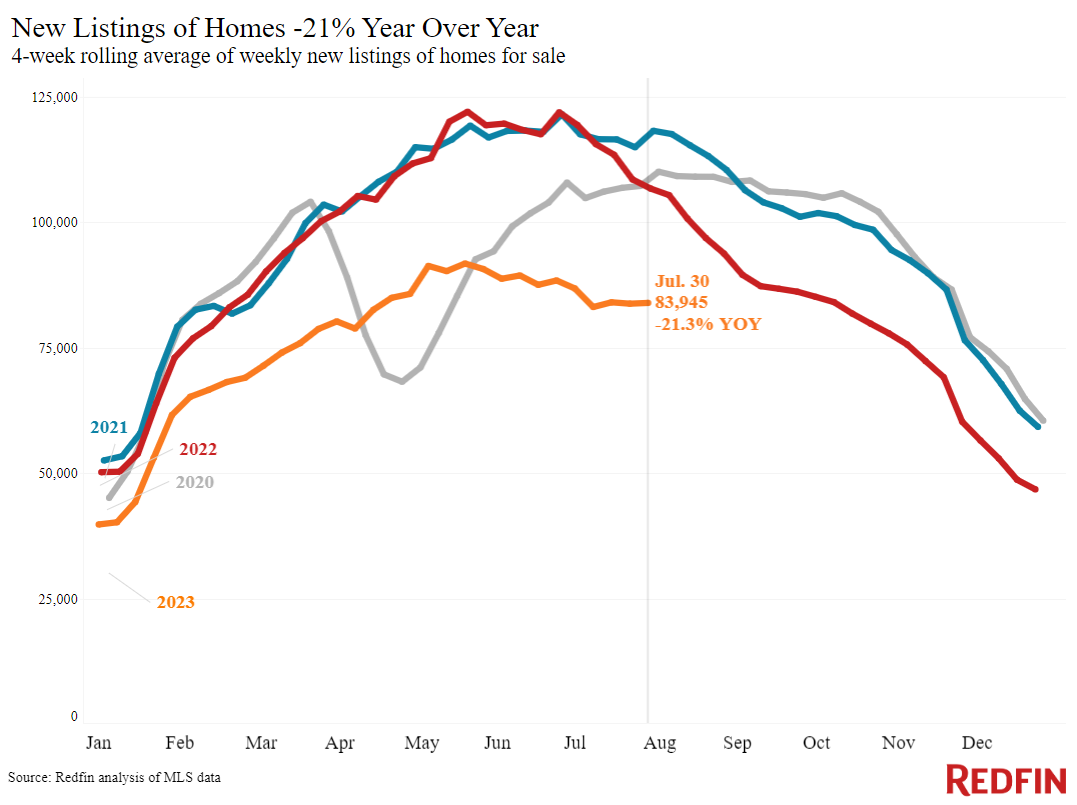
Home prices are increasing because of the mismatch between supply and demand. High mortgage rates have pushed many would-be sellers out of the market, with homeowners hanging onto their relatively low rates. The total number of homes for sale is down 19%, the biggest drop in a year and a half, and new listings are down 21%.
Yes, high rates are also sidelining prospective buyers, but ironically not as much as they’re deterring would-be sellers, who are holding on to rates achieved during the last refi – most in the 4% or lower bracket – and are loath to take out a new mortgage with a 6 or 7 handle. Redfin’s Homebuyer Demand Index, which measures early-stage demand through requests for tours and other buying services from Redfin agents, is down just 4% from a year ago.
Some more leading indicators of homebuying activity from Redfin:
- For the week ending August 3, the average 30-year fixed mortgage rate was 6.9%, slightly higher than a week earlier but slightly lower than the half-year high hit three weeks earlier. The daily average was 7.2% on August 3.
- Mortgage-purchase applications during the week ending July 28 declined 3% from a week earlier, seasonally adjusted. Purchase applications were down 26% from a year earlier.
- The seasonally adjusted Redfin Homebuyer Demand Index–a measure of requests for home tours and other homebuying services from Redfin agents–was down 4% from a month earlier, and down 4% from a year earlier.
- Google searches for “homes for sale” were up essentially flat from a month earlier during the week ending July 29, and down about 16% from a year earlier.
- Touring activity as of July 28 was up 8% from the start of the year, compared with a 5% decrease at the same time last year, according to home tour technology company ShowingTime.
And a summary of the data based on homes listed and/or sold during the period:
- The median home sale price was $380,250, up 3.2% from a year earlier. That’s the biggest increase since November.
- Sale prices increased most in Miami (12.7% YoY), Cincinnati (9%), Milwaukee (8.6%), Anaheim, CA (8.5%) and West Palm Beach, FL (8.4%).
- Home-sale prices declined in 19 metros, with the biggest drops in Austin, TX (-9.9% YoY), Phoenix (-4.2%), Detroit (-3.9%), Las Vegas (-3.5%) and Fort Worth, TX (-3.2%).
- The median asking price of newly listed homes was $387,223, up 1.7% from a year earlier.
- The monthly mortgage payment on the median-asking-price home was $2,605 at a 6.9% mortgage rate, the average for the week ending August 3. That’s down about 1% ($32) from the record high hit three weeks earlier, but up 19% from a year earlier.
- Pending home sales were down 14.4% year over year, continuing a year-plus streak of double-digit declines.
- Pending home sales fell in all but two of the metros Redfin analyzed. They declined most in Providence, RI (-29.5% YoY), Newark, NJ (-28.8%), Warren, MI (-26.4%), Boston (-26.3%) and Cincinnati (-25.1%). They increased 3.5% in Las Vegas and were flat in Austin.
- New listings of homes for sale fell 21.3% year over year. That’s a substantial decline, but the smallest in three months.
- New listings declined in all metros Redfin analyzed. They fell most in Las Vegas (-43.4% YoY), Phoenix (-39.7%), Providence, RI (-32%), Sacramento, CA (-31.9%) and Oakland, CA (-30.7%).
- Active listings (the number of homes listed for sale at any point during the period) dropped 19% from a year earlier, the biggest drop since February 2022. Active listings were down slightly from a month earlier; typically, they post month-over-month increases at this time of year.
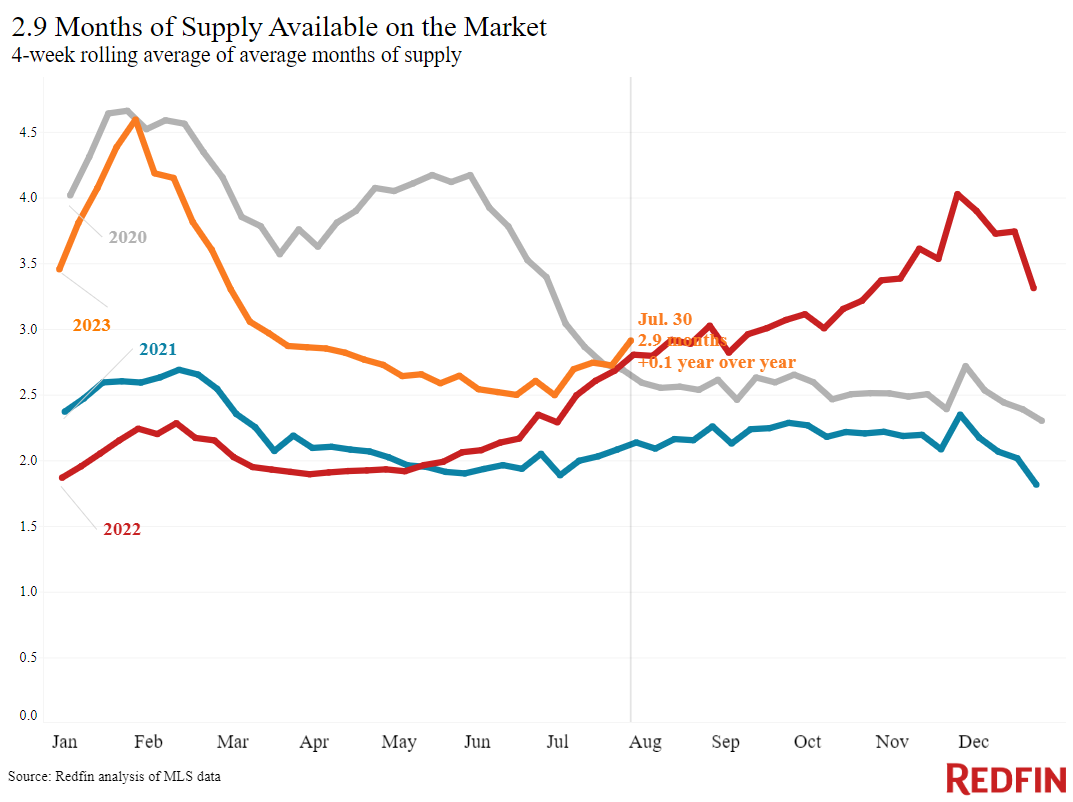
- Months of supply—a measure of the balance between supply and demand, calculated by the number of months it would take for the current inventory to sell at the current sales pace—was 2.9 months, the highest level since April. Four to five months of supply is considered balanced, with a lower number indicating seller’s market conditions.
- 43.7% of homes that went under contract had an accepted offer within the first two weeks on the market, up from 42% a year earlier.
- Homes that sold were on the market for a median of 27 days, up from 23 days a year earlier.
- 35.9% of homes sold above their final list price, down from 43% a year earlier.
- On average, 5.8% of homes for sale each week had a price drop, down from 6.3% a year earlier.
- The average sale-to-list price ratio, which measures how close homes are selling to their final asking prices, was 100%. That’s down from 100.7% a year earlier.
Source: Redfin