Current Trends
The Federal Budget Deficit for July 2021 was 302B which was up 73.4% over June and 16.5% above the TTM average of 238B. The chart below shows the Federal Budget for the previous 18 months.
This article was originally published by Schiff Gold.
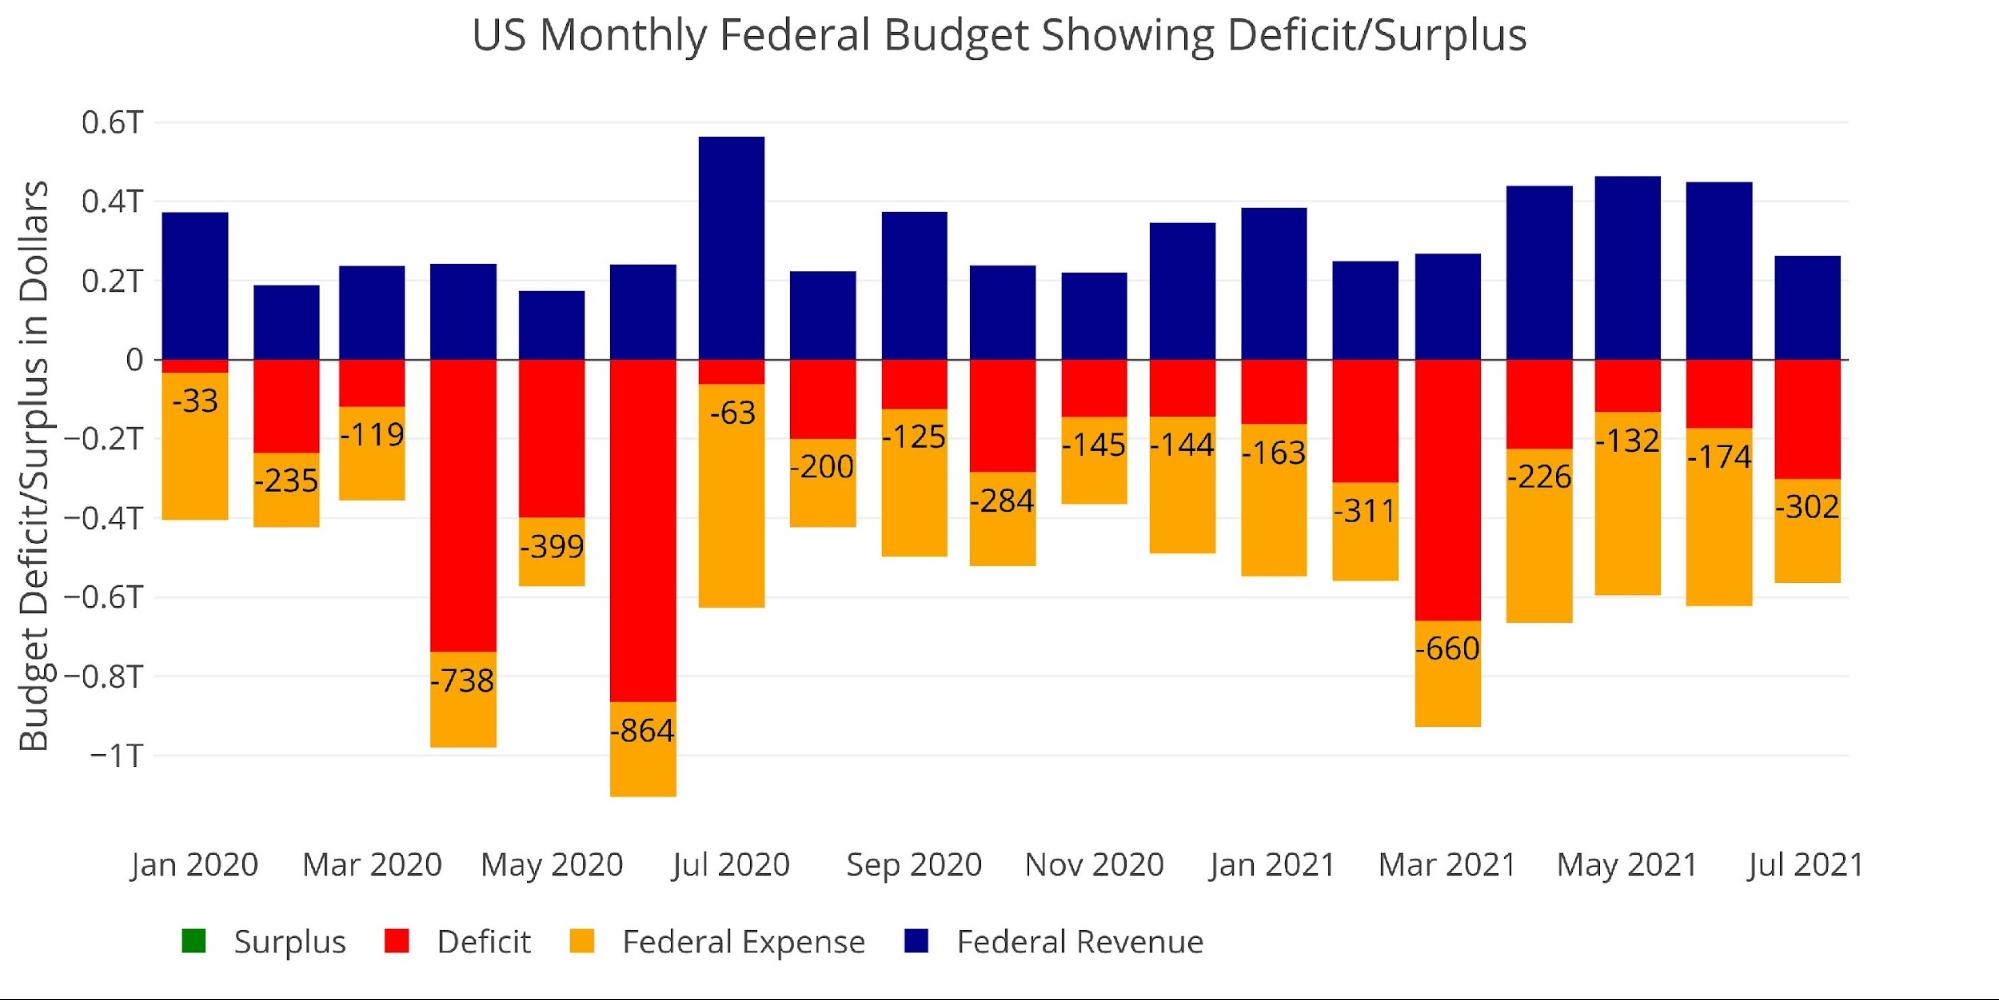
To better understand what is driving the large outlays and receipts, the next two charts break down both sides of the budget into different categories.
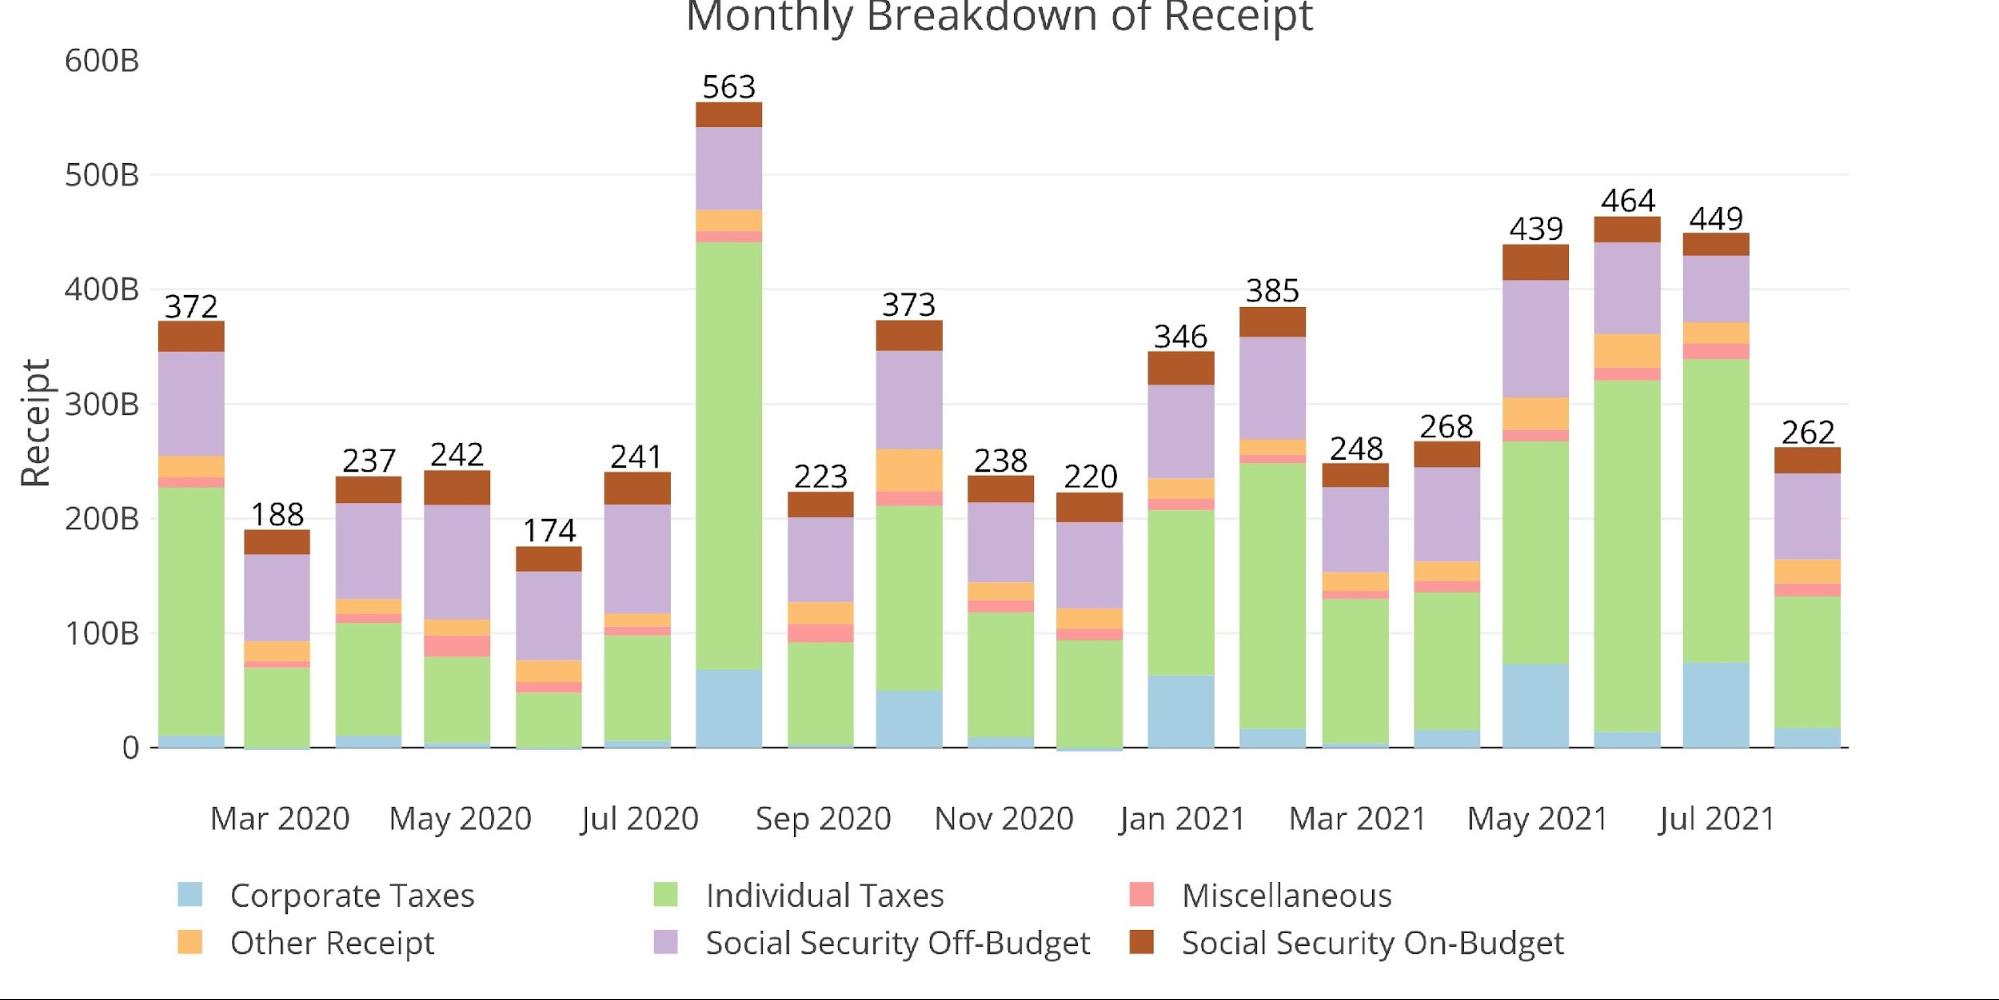
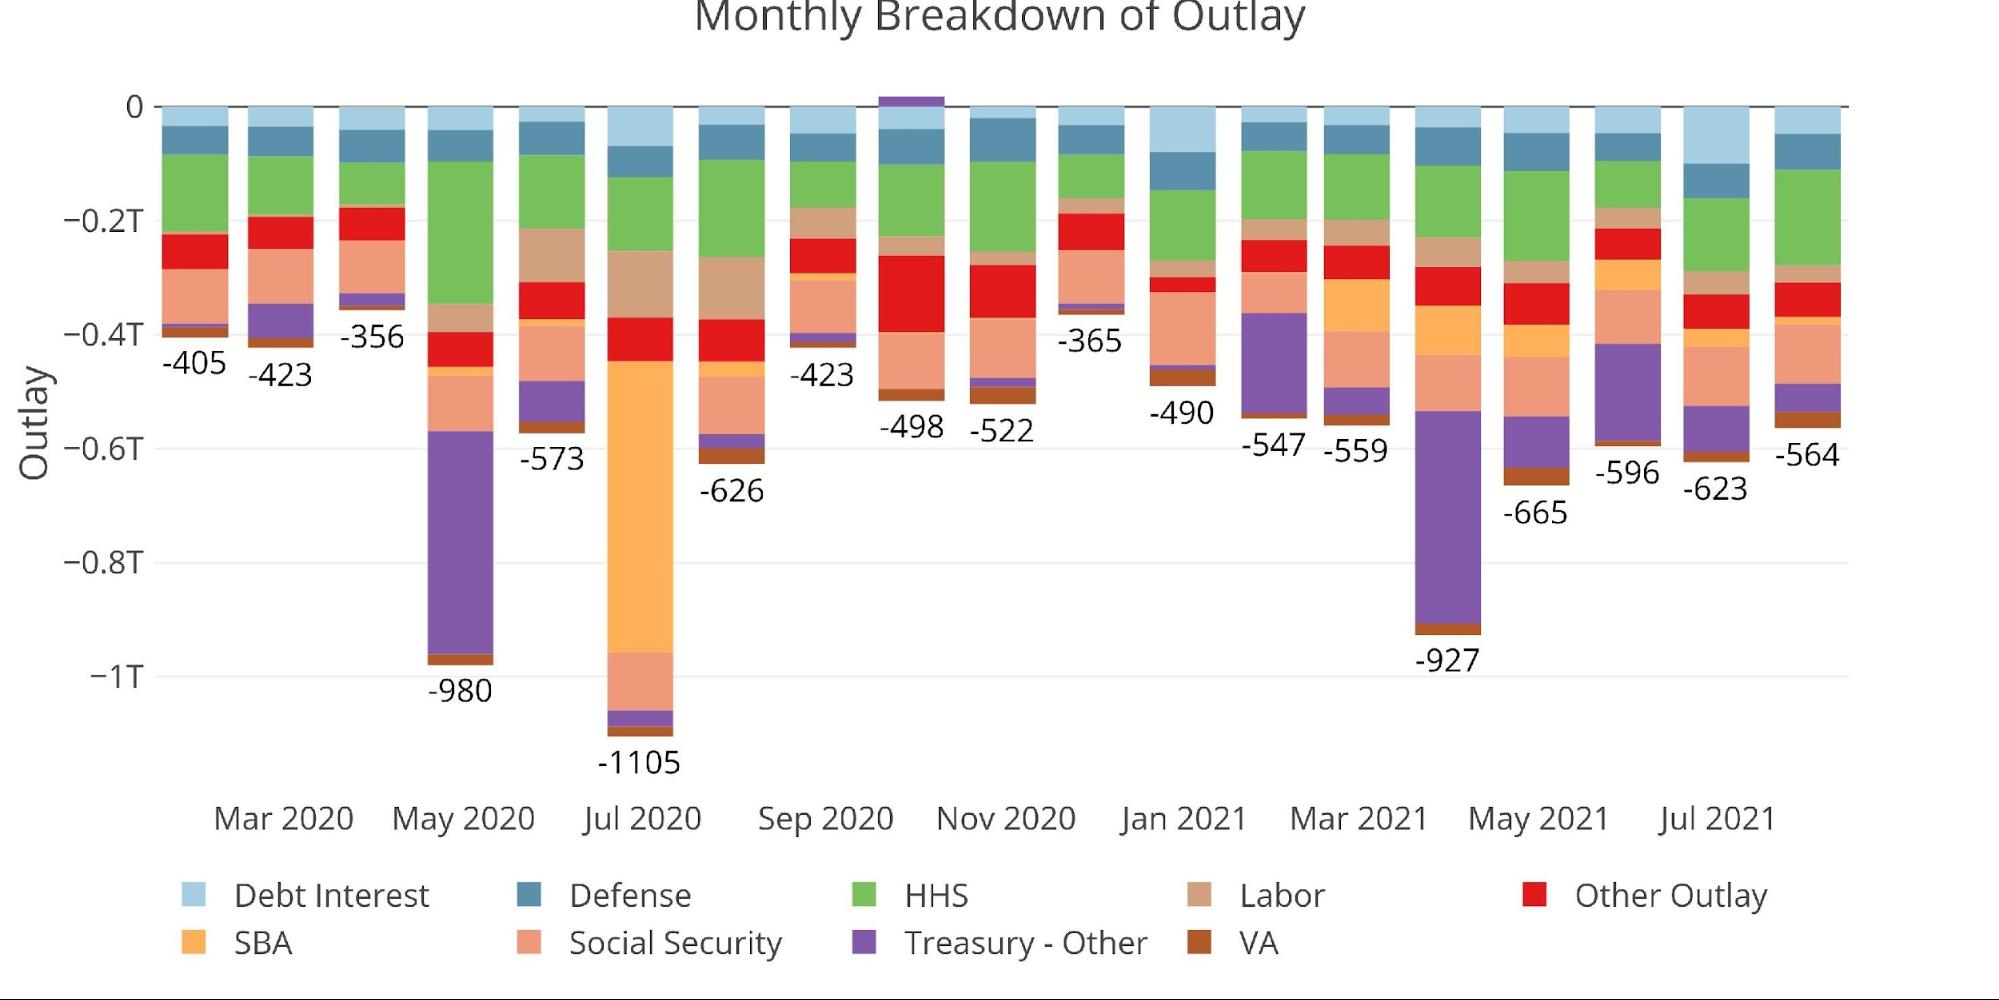
The table below goes deeper into the numbers of each category. The key takeaways from the charts and table:
Total
- Outlays fell by 10% but Receipts collapsed by 42% as tax season has concluded
- On a TTM basis, Outlays are 55% above where they were in the period ending Jul 2019 where receipts are only up ~15%
Outlays
- Health and Human Services continue to burn funds to fight the pandemic. Total spending on TTM basis has been near 1.5T for the last two TTM periods. This compares to 1.2T pre-pandemic.
- Stimulus Checks (Treasury – Other) dropped significantly last month from 80B to 50B. On a TTM basis, it is still very high. While this should fall, it will probably not revert to pre-pandemic levels due to the new child tax credit.
- Labor Department and SBA are seeing spending fall back to normal levels now that Unemployment benefits are expiring and PPP loans have completed.
- Debt interest is actually below where it was back in 2019 despite significant growth in total debt. More detail can be found in the US Debt analysis article.
Receipts
- Corporate Taxes are up huge compared to the last two TTM periods. The latest period was 333B vs ~215B in the last two periods for a better than 50% increase.
- Individual Taxes were also up big, increasing from ~1.65T to nearly 2T, around an 18% increase. Stimulus checks are taxed plus incomes have been increasing during the pandemic.
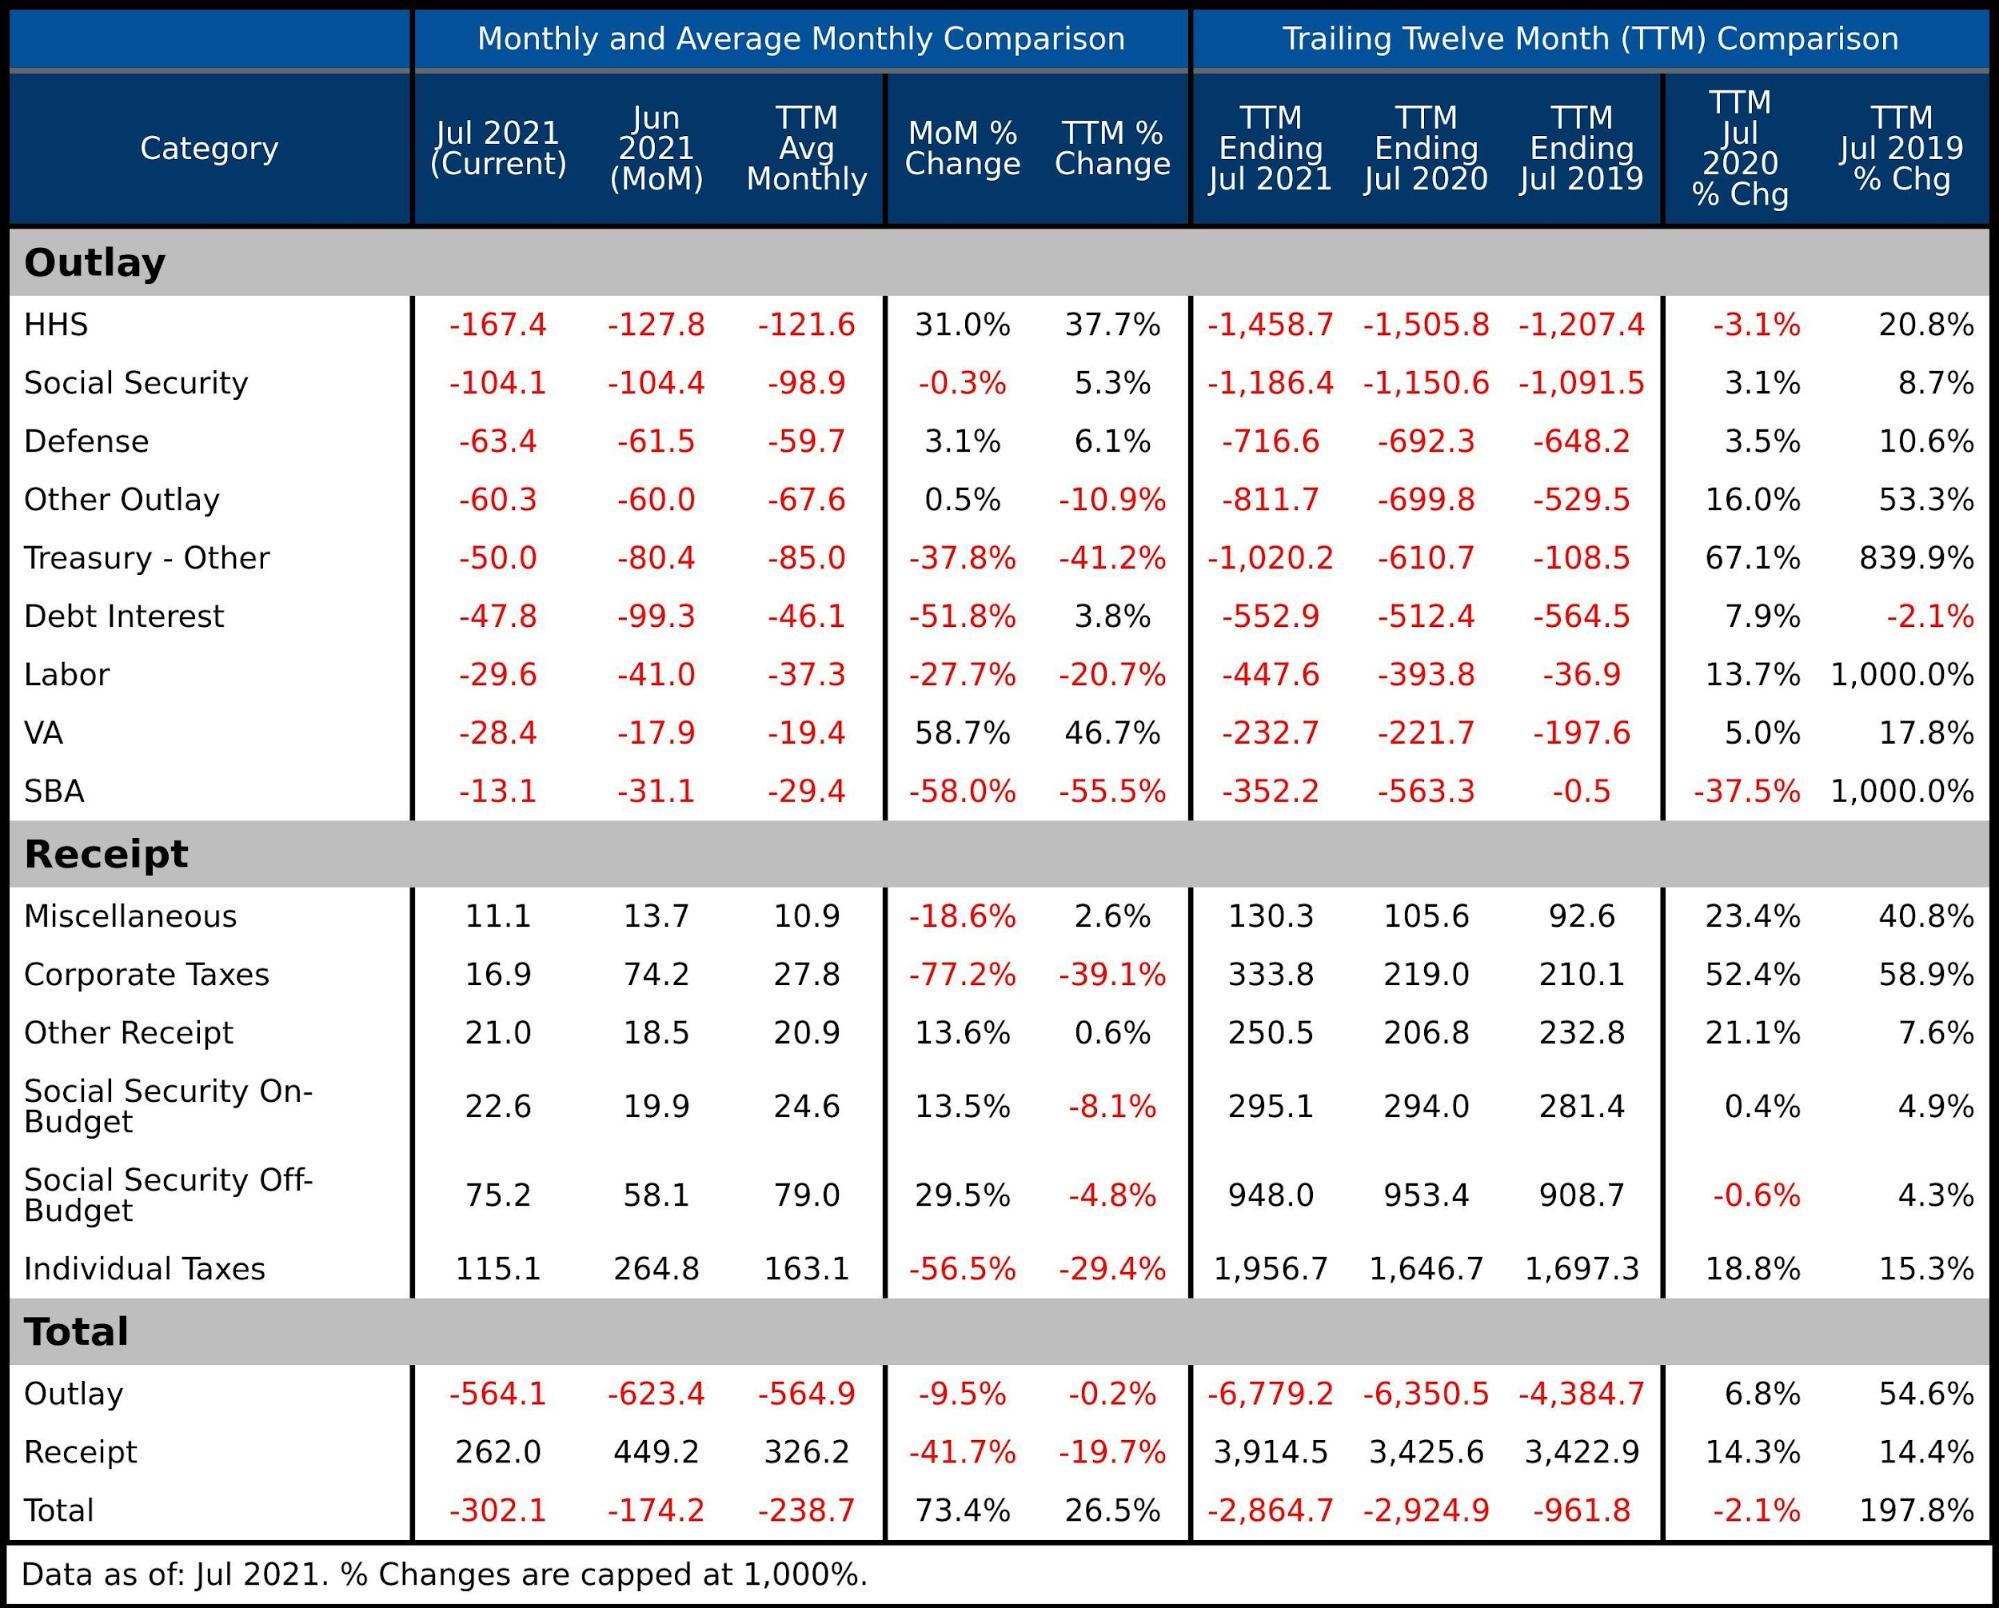
Figure: 4 US Budget Detail
The current surge in tax revenue could be attributed to increased stimulus. As the stimulus slows, spending will fall but so will tax receipts. The question going forward is how this dynamic plays out and whether deficits can fall back into a range closer to $1T (still extremely large by historic standards). With new spending planned and a potentially weaker than expected economy, it is hard to see a scenario where the budget deficit comes into a sustainable range.
The chart below looks at expenditures on a TTM basis back to 2016. As can be seen, spending was increasing steadily before the pandemic. Considering the current administration and congress, this trend is not likely to slow. Additionally, politicians are using the last 18 months as evidence that they can spend massive amounts without immediate repercussions. Eventually, the spending will catch up to the economy and budget, and the can can no longer be kicked down the road.
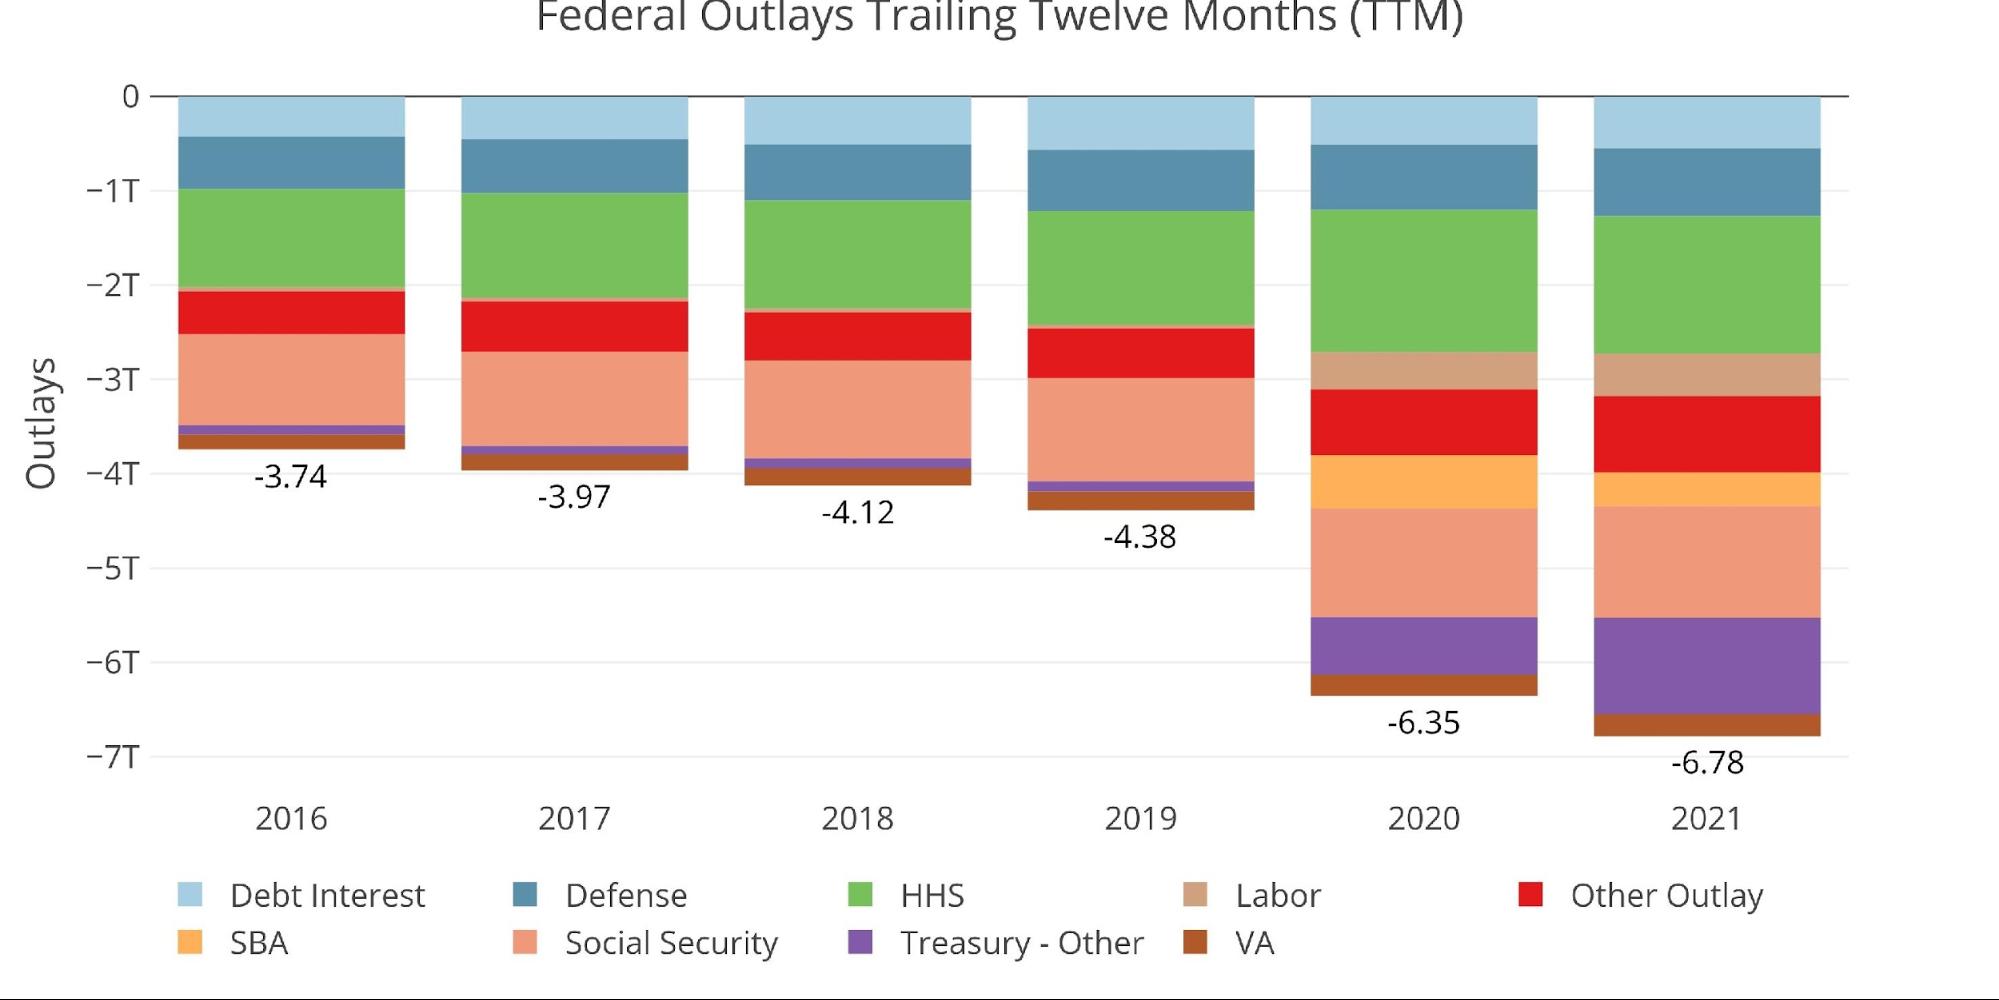
Figure: 5 Monthly Federal Budget
Historical Perspective
Zooming out and looking over the history of the budget back to 1980 shows a complete picture and just how extreme the last two years have been. The chart below shows the data on a TTM basis to smooth out the lines.
While the current extreme period will pass, new spending has been planned, not to mention bills finally coming due (e.g. baby boomer social security payments). This makes it unlikely the federal budget deficit will ever get back below $1T despite CBO projections for sub $1T for 2023-2025.
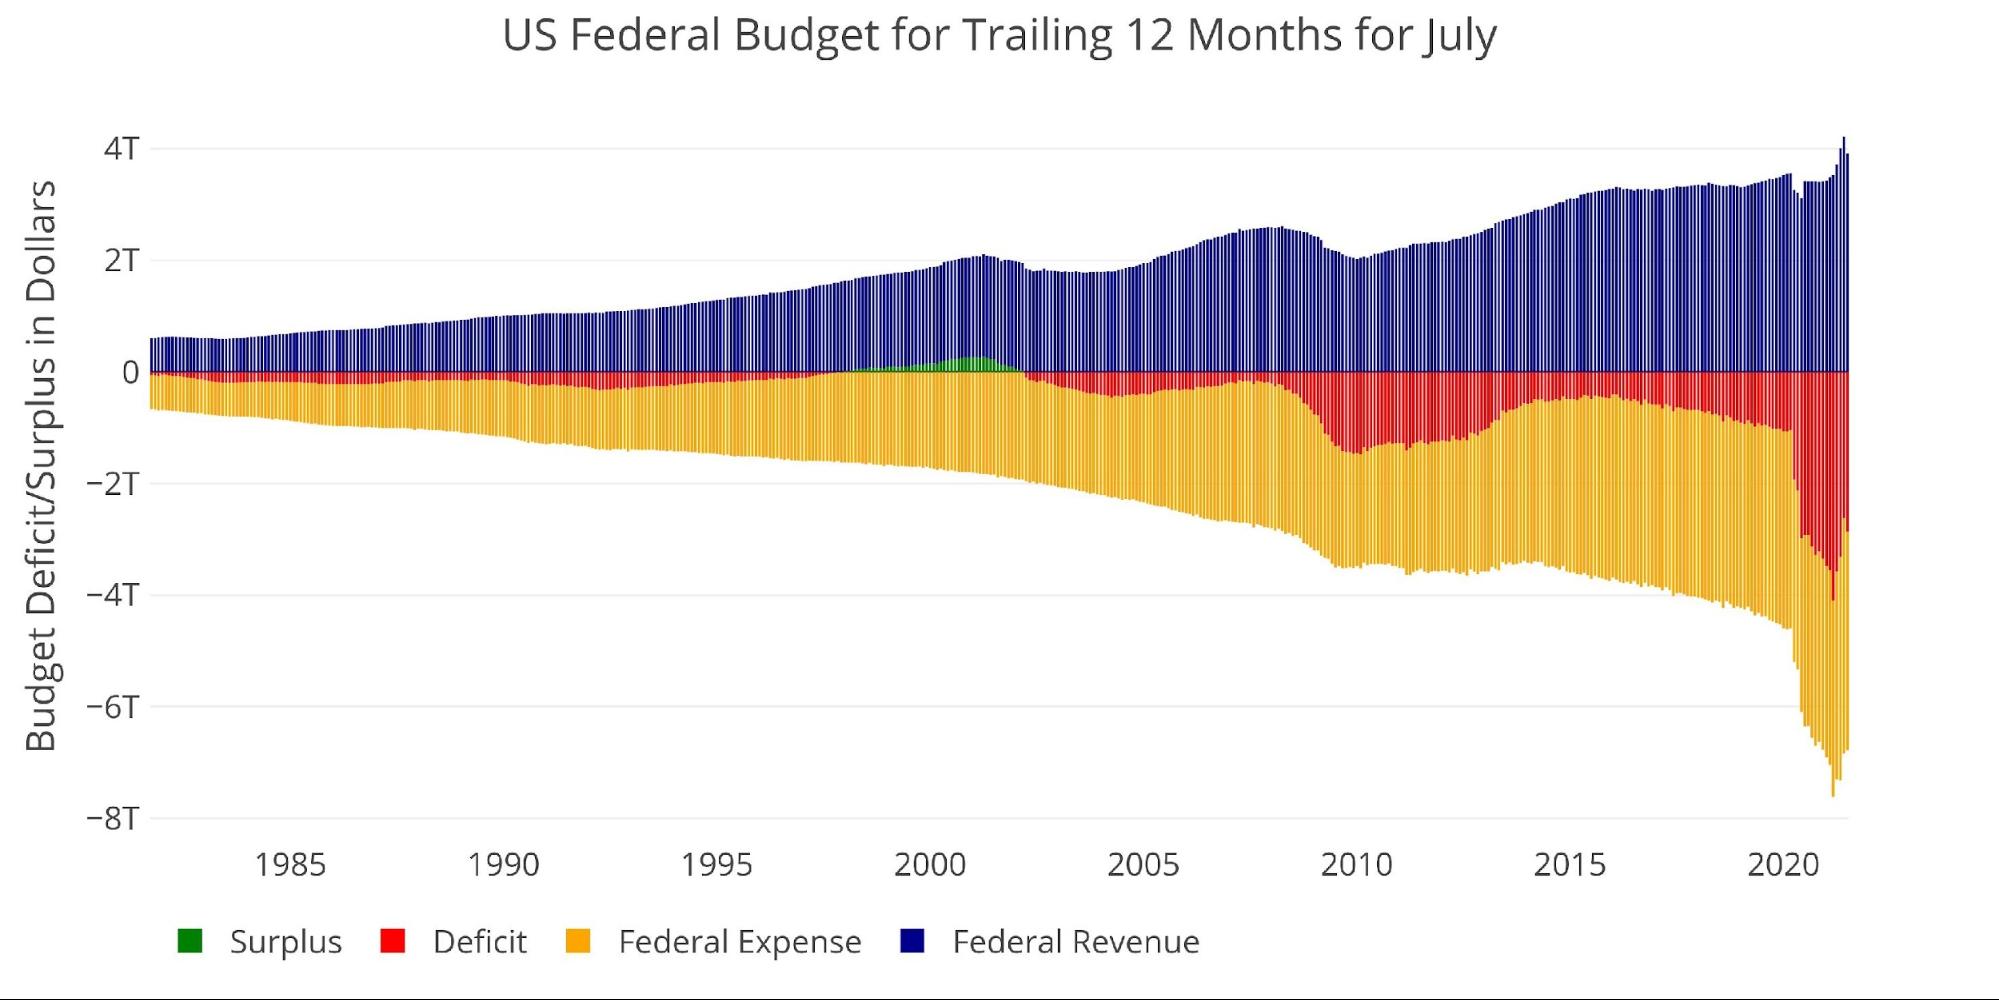
Figure: 6 Trailing 12 Months (TTM)
While the chart above does not paint a pretty picture, it is important to put the entire economy in perspective. Below compares the TTM federal deficit to GDP. The peaks below are not solely driven by increases in debt. Usually, recessions (which by definition are 2 quarters of falling GDP) are accompanied by increased spending in the form of stimulus.
With this context, it makes the lead up to 2020 more concerning. The ratio had started rising in 2015 even though GDP was rising. This indicates deficits were growing at a faster clip than GDP. Even without Covid or the new spending, this trend was set to continue. It is unlikely the US TTM deficit will get back below 5% of GDP without major reductions in government spending.
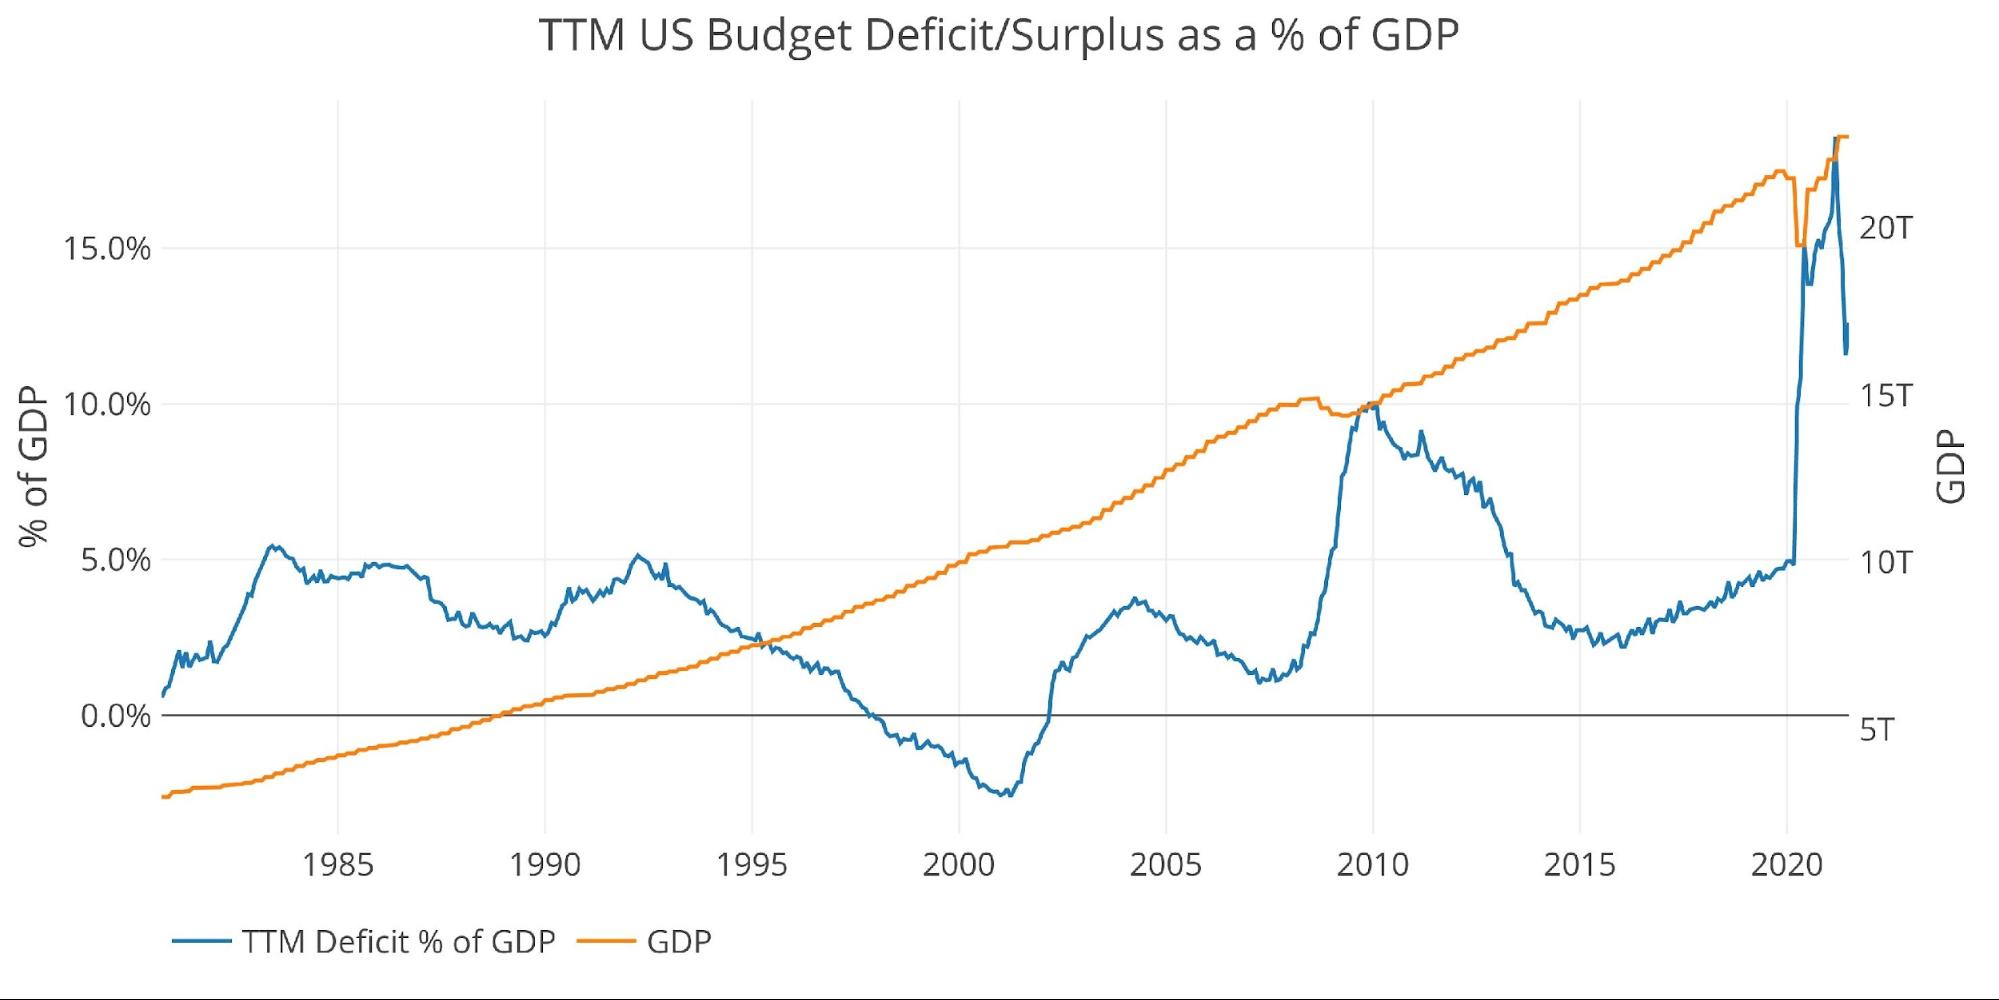
Figure: 7 TTM vs GDP
Finally, to compare the calendar year with previous calendar years, the plot below shows the Year to Date (YTD) figures for each year through the current month. The government fiscal year technically ends in September, but that is harder to contextualize (e.g. when did Covid start concerning October vs January). Now that all stimulus packages have been enacted, it will be interesting to see if the current year falls further behind 2020 in the coming months. 2021 is on track to also be a record year in terms of revenue.
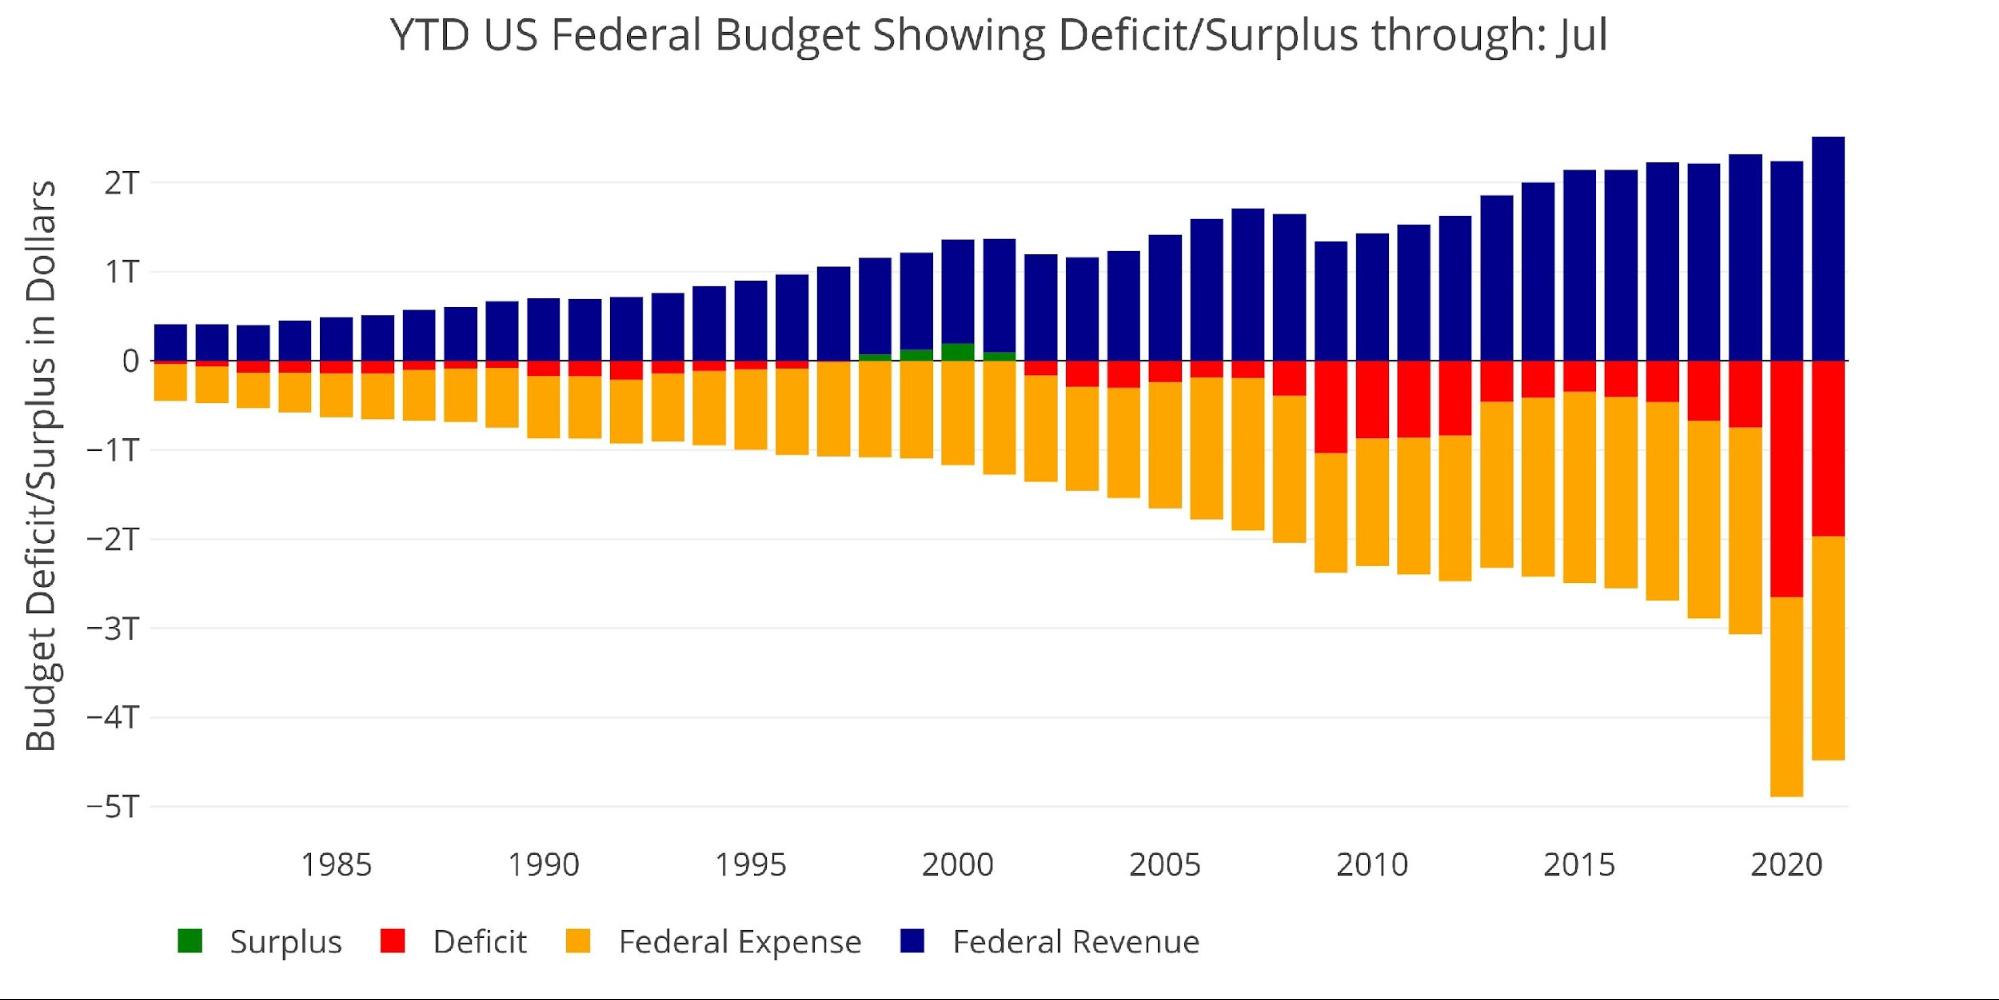
Figure: 8 Year to Date


