Have you ever wondered how much U.S. currency is in circulation?
This article was written by Marcus Lu and originally published by The Visual Capitalist.
Every year, the U.S. Federal Reserve submits a print order for U.S. currency to the Treasury Department’s Bureau of Engraving and Printing (BEP). The BEP will then print billions of notes in various denominations, from $1 bills to $100 bills.
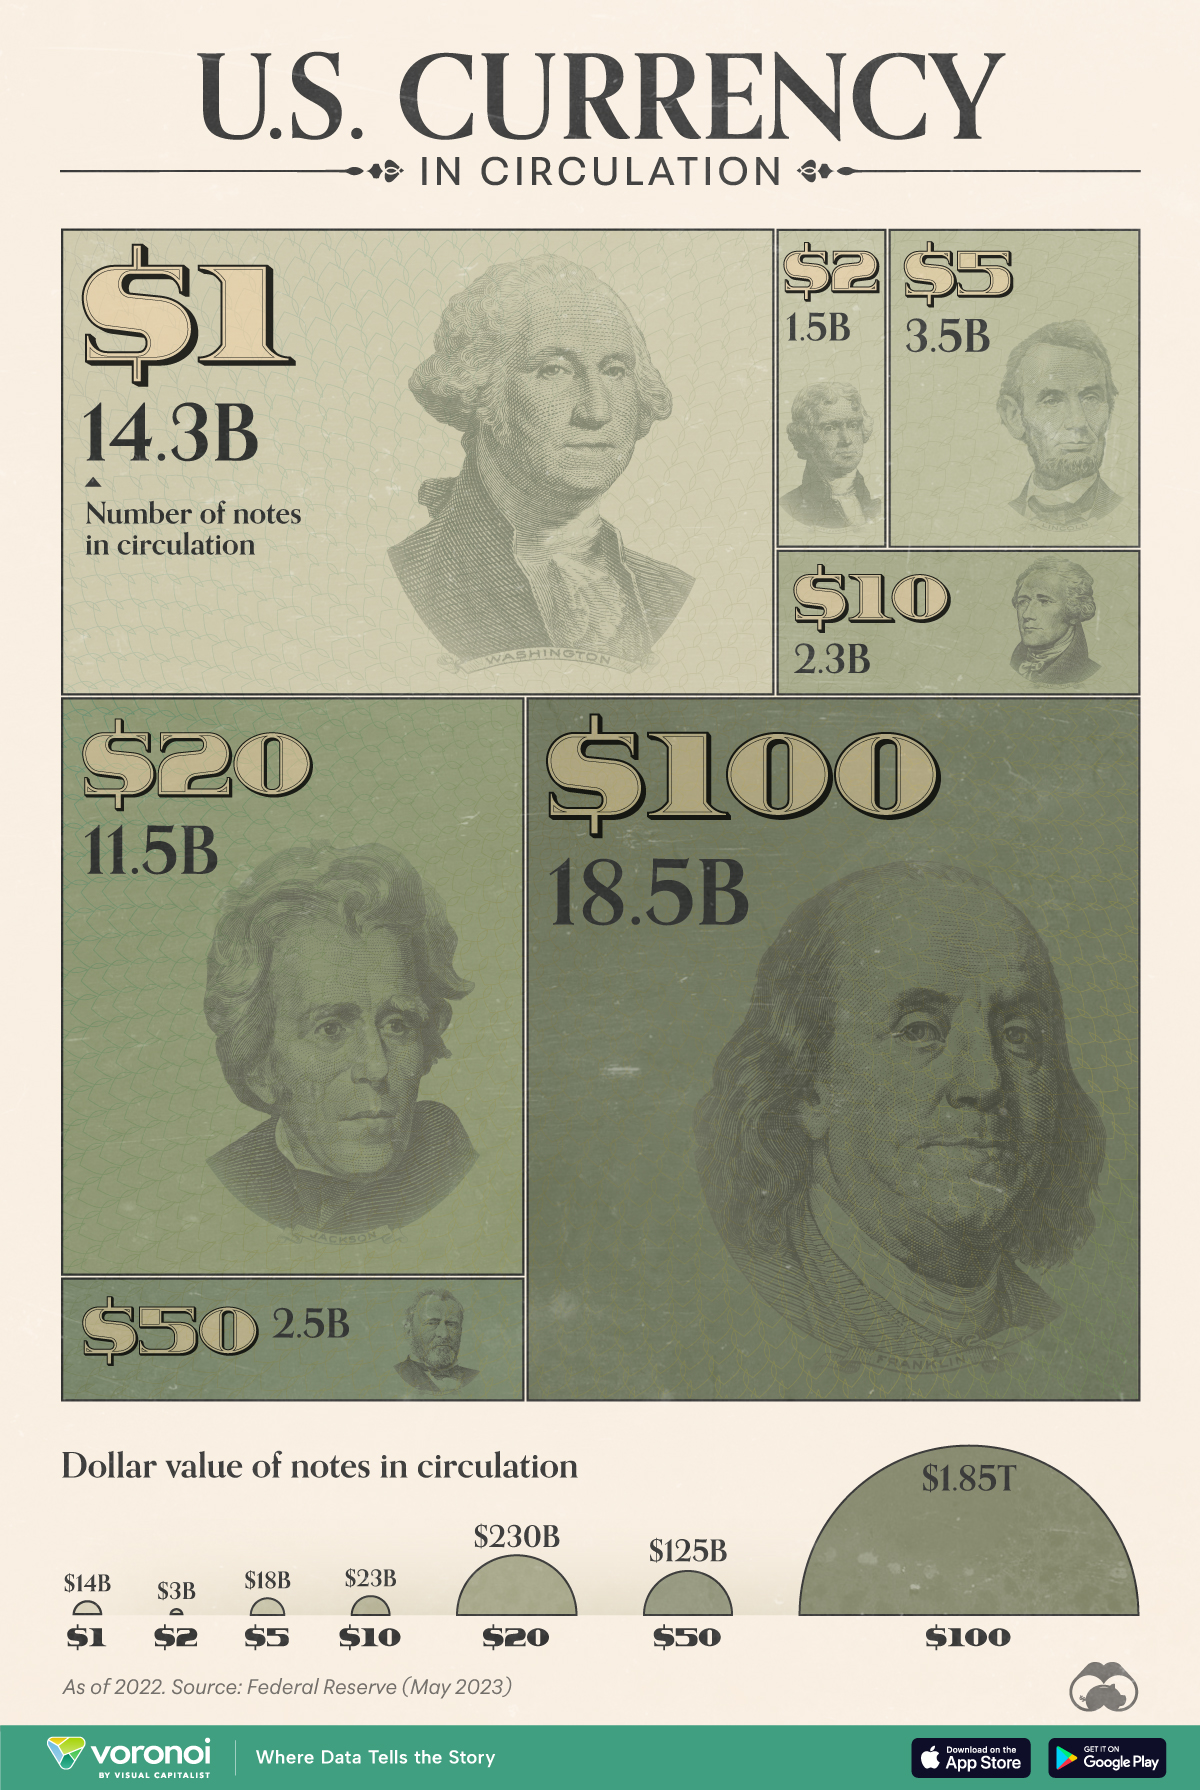
In this graphic, we’ve used the latest Federal Reserve data to visualize the approximate number of bills for each denomination globally, as of Dec. 31, 2022.
Breakdown of U.S. Currency in Circulation
The following table lists all of the data we used to create the visualization above. Note that value figures were rounded for simplicity.
| Type of Bill | Number of notes in circulation (billions) |
Value ($B) |
|---|---|---|
| $1 | 14.3 | $14B |
| $2 | 1.5 | $3B |
| $5 | 3.5 | $18B |
| $10 | 2.3 | $23B |
| $20 | 11.5 | $230B |
| $50 | 2.5 | $125B |
| $100 | 18.5 | $1,850B |
| $500-10,000* | 0.0004 | n/a |
*$500-10,000 bills are listed as a range, and a total circulation of 0.0004 billion. Not included in graphic.
From these numbers, we can see that $100 bills are the most common bill in circulation, even ahead of $1 bills.
One reason for this is $100 bills have a longer lifespan than smaller denominations, due to people using $100 bills less often for transactions. Some businesses may also decline $100 bills as payment.
Based on 2018 estimates from the Federal Reserve, a $100 bill has a lifespan of over 20 years, which is significantly higher than $1 bills (7 years) and $5 bills (5 years).