Similar to last month, the Treasury is using extraordinary measures to keep the total debt balance below the current debt ceiling.
The big moves this month were rolling off $150B in Non-Marketable security to allow $120B in T-Bills to be added to the debt. With all the moves, the total effect on the debt was to add only $4B.
This article was originally published by Schiff Gold.
Note: Non-Marketable consists almost entirely of debt the government owes to itself (e.g., debt owed to Social Security or public retirement)
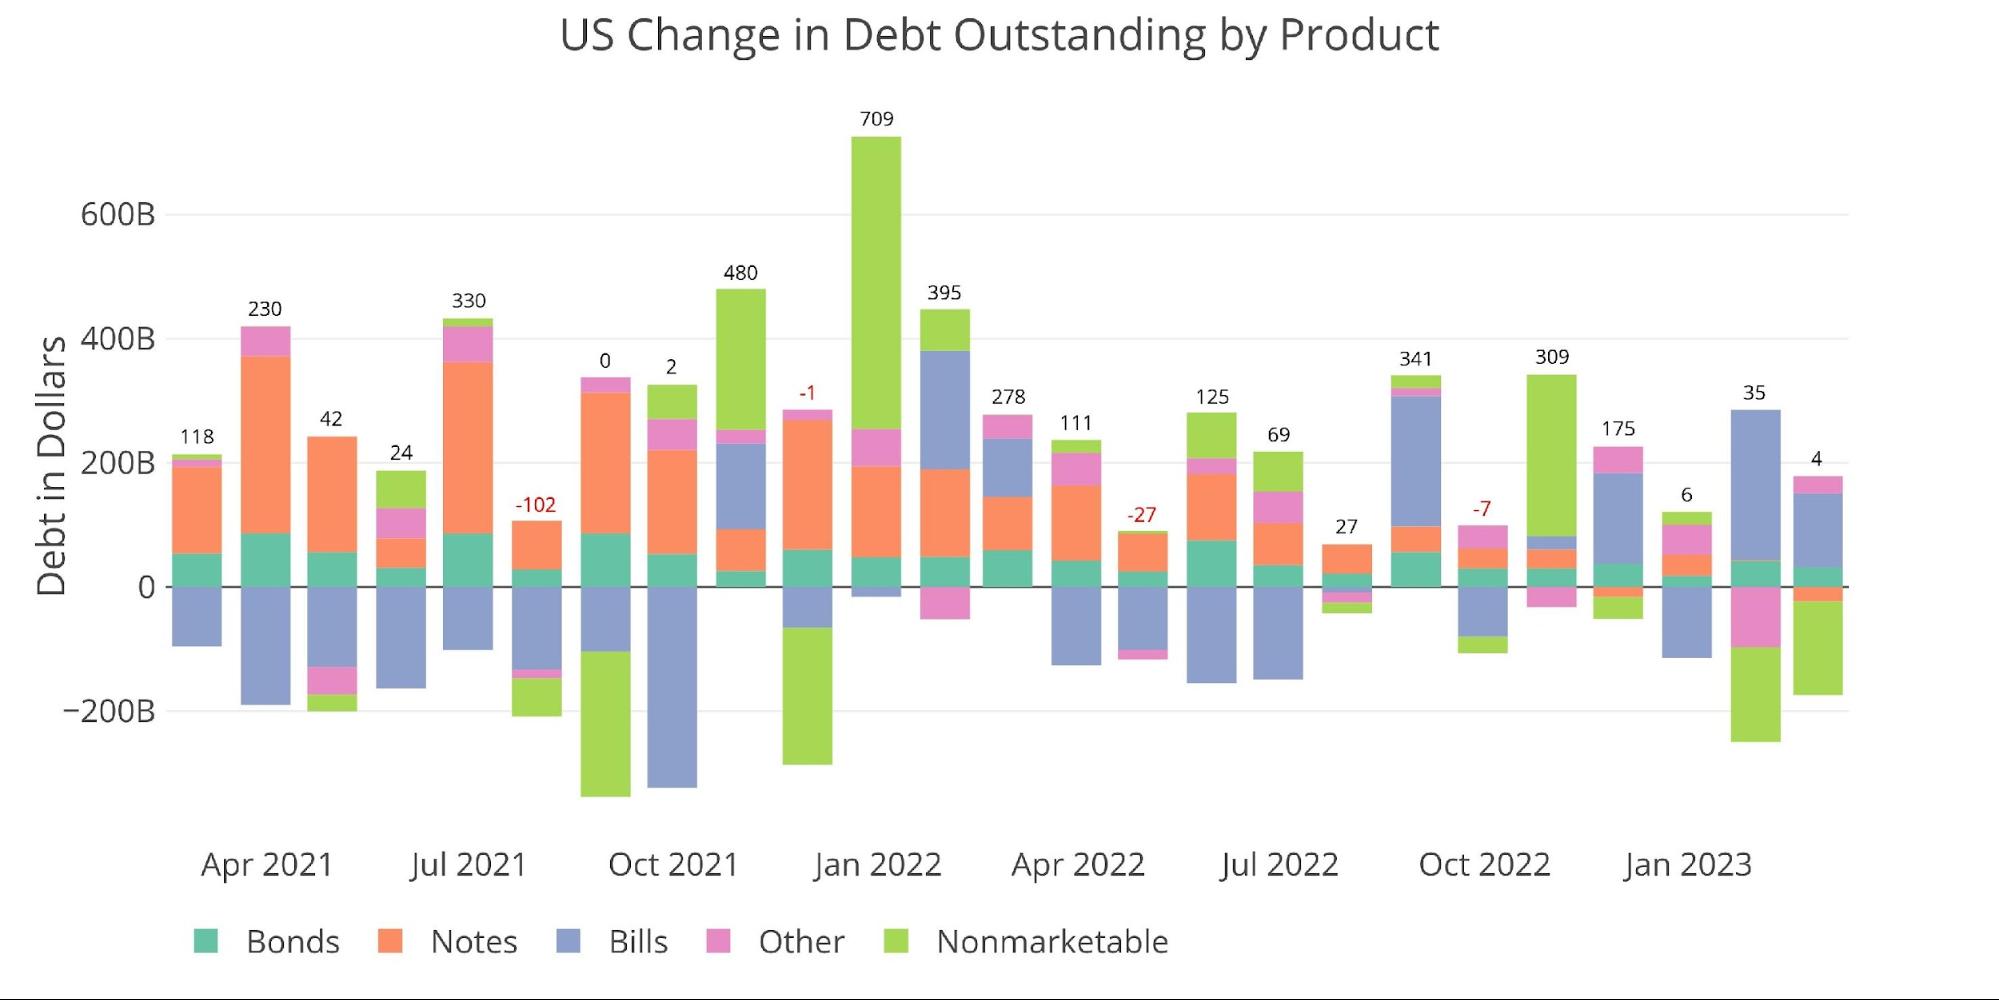
Figure: 1 Month Over Month change in Debt
Given the current debt ceiling saga, the total debt added for the current calendar year does not amount to anything material. The only thing to really notice is the big surge in short-term debt issuance. The Treasury is using short-term bills because they will be easier to roll off once the debt ceiling saga ends and replace with non-Marketable debt.
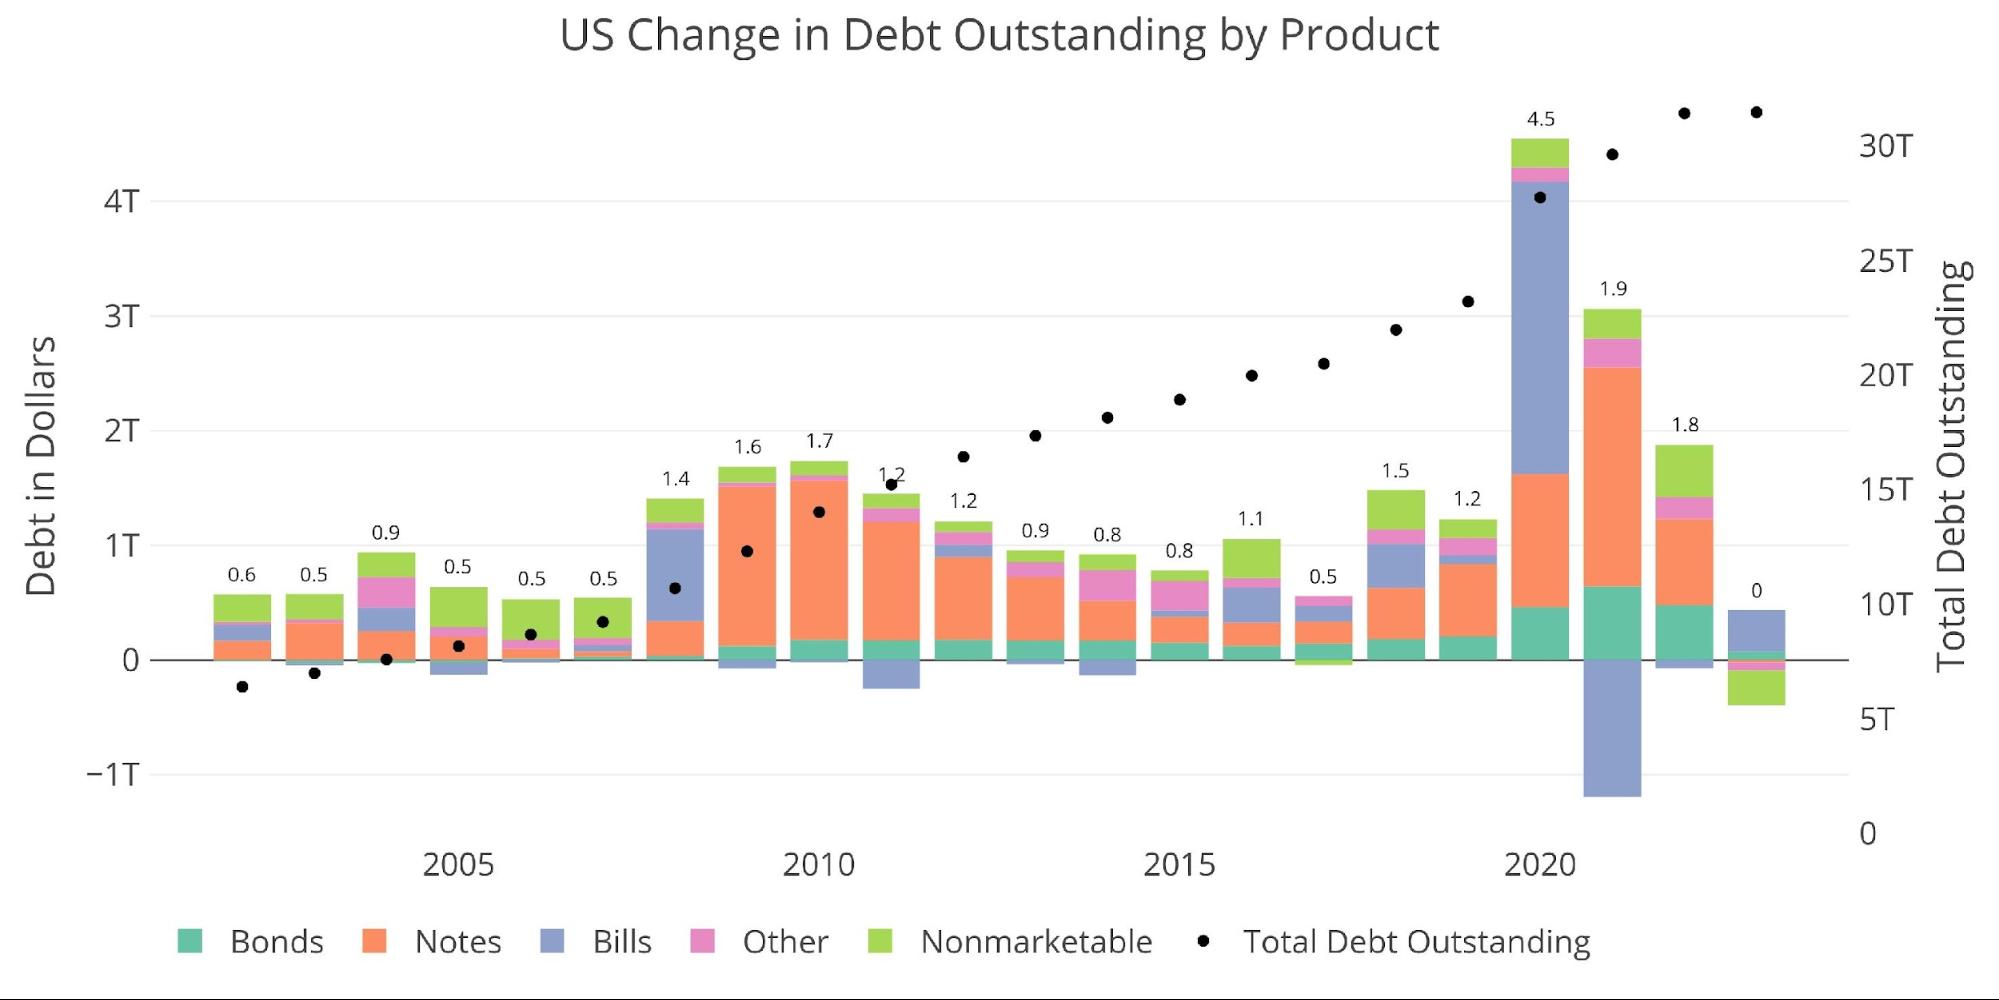
Figure: 2 Year Over Year change in Debt
In addition to using extraordinary measures with Non-Marketable debt, the Treasury has additional room to maneuver with the cash balance it holds currently. It currently sits at $351B, but that is down from $580B as recently as January.
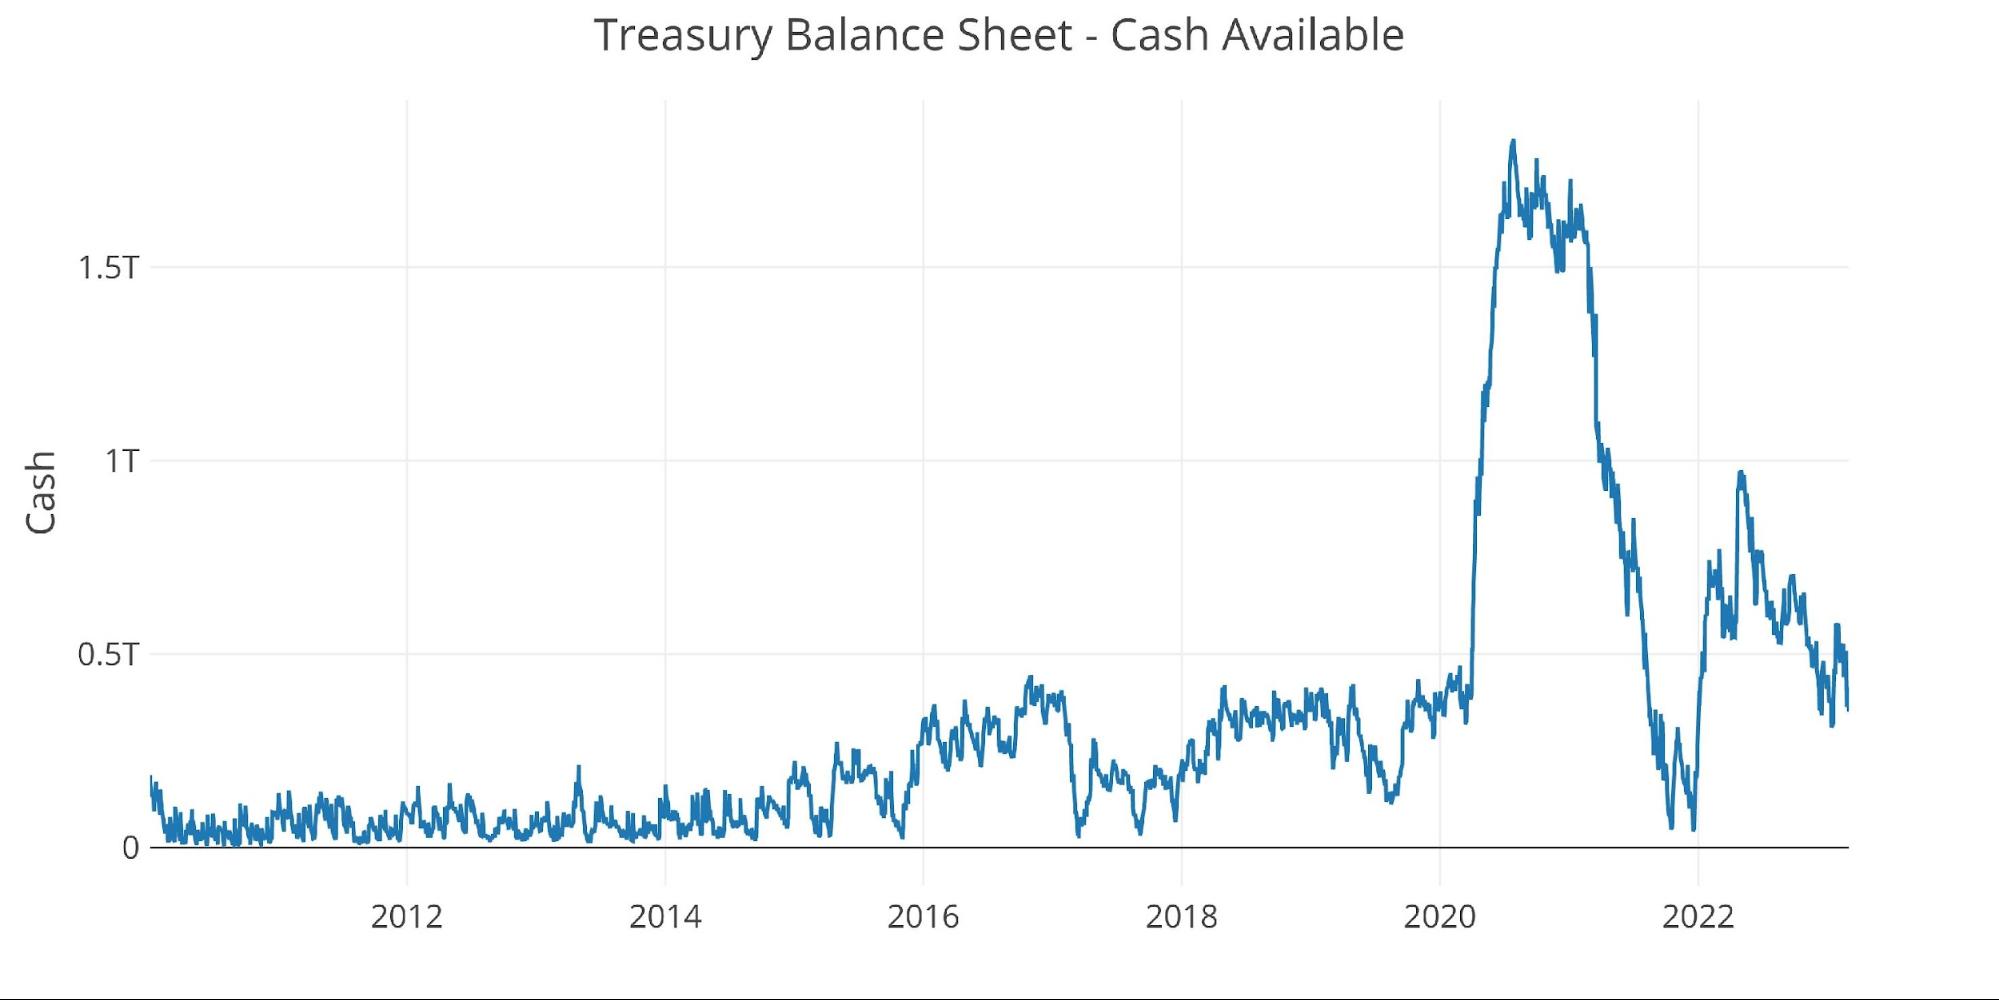
Figure: 3 Treasury Cash Balance
Average maturity on the debt has mostly stabilized in recent months, but the weighted average interest rate continues to rise precipitously. It now stands at 2.22%, up from 1.32% only one year ago.
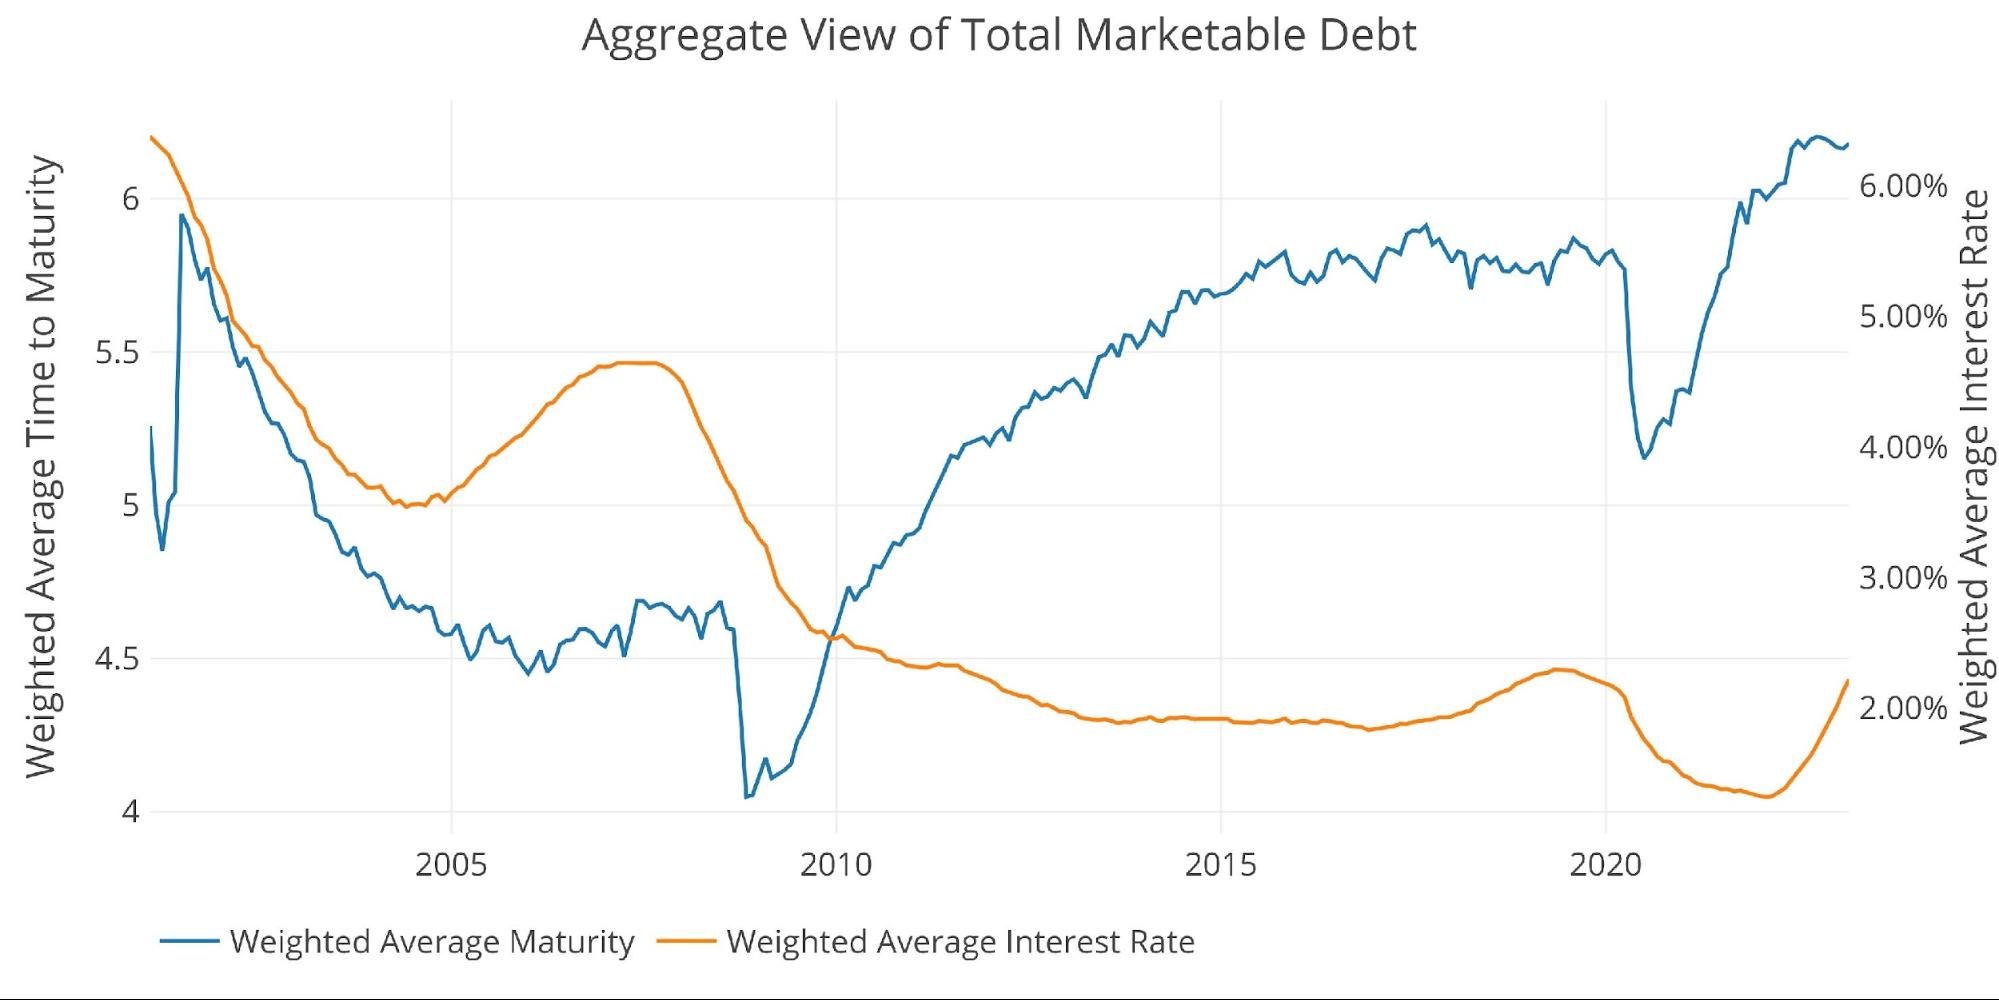
Figure: 4 Weighted Averages
The impact of rising rates can be seen below, specifically the blue bars which represent short-term Bills. Interest is exploding upwards at an unsustainable pace. Annualized interest on the debt increased by $25B in a single month. This means that in 30 days, the cost of servicing the debt annually increased by almost 5%. That is an incredible rate of increase!
In a single year, debt servicing costs have risen an incredible 75%.
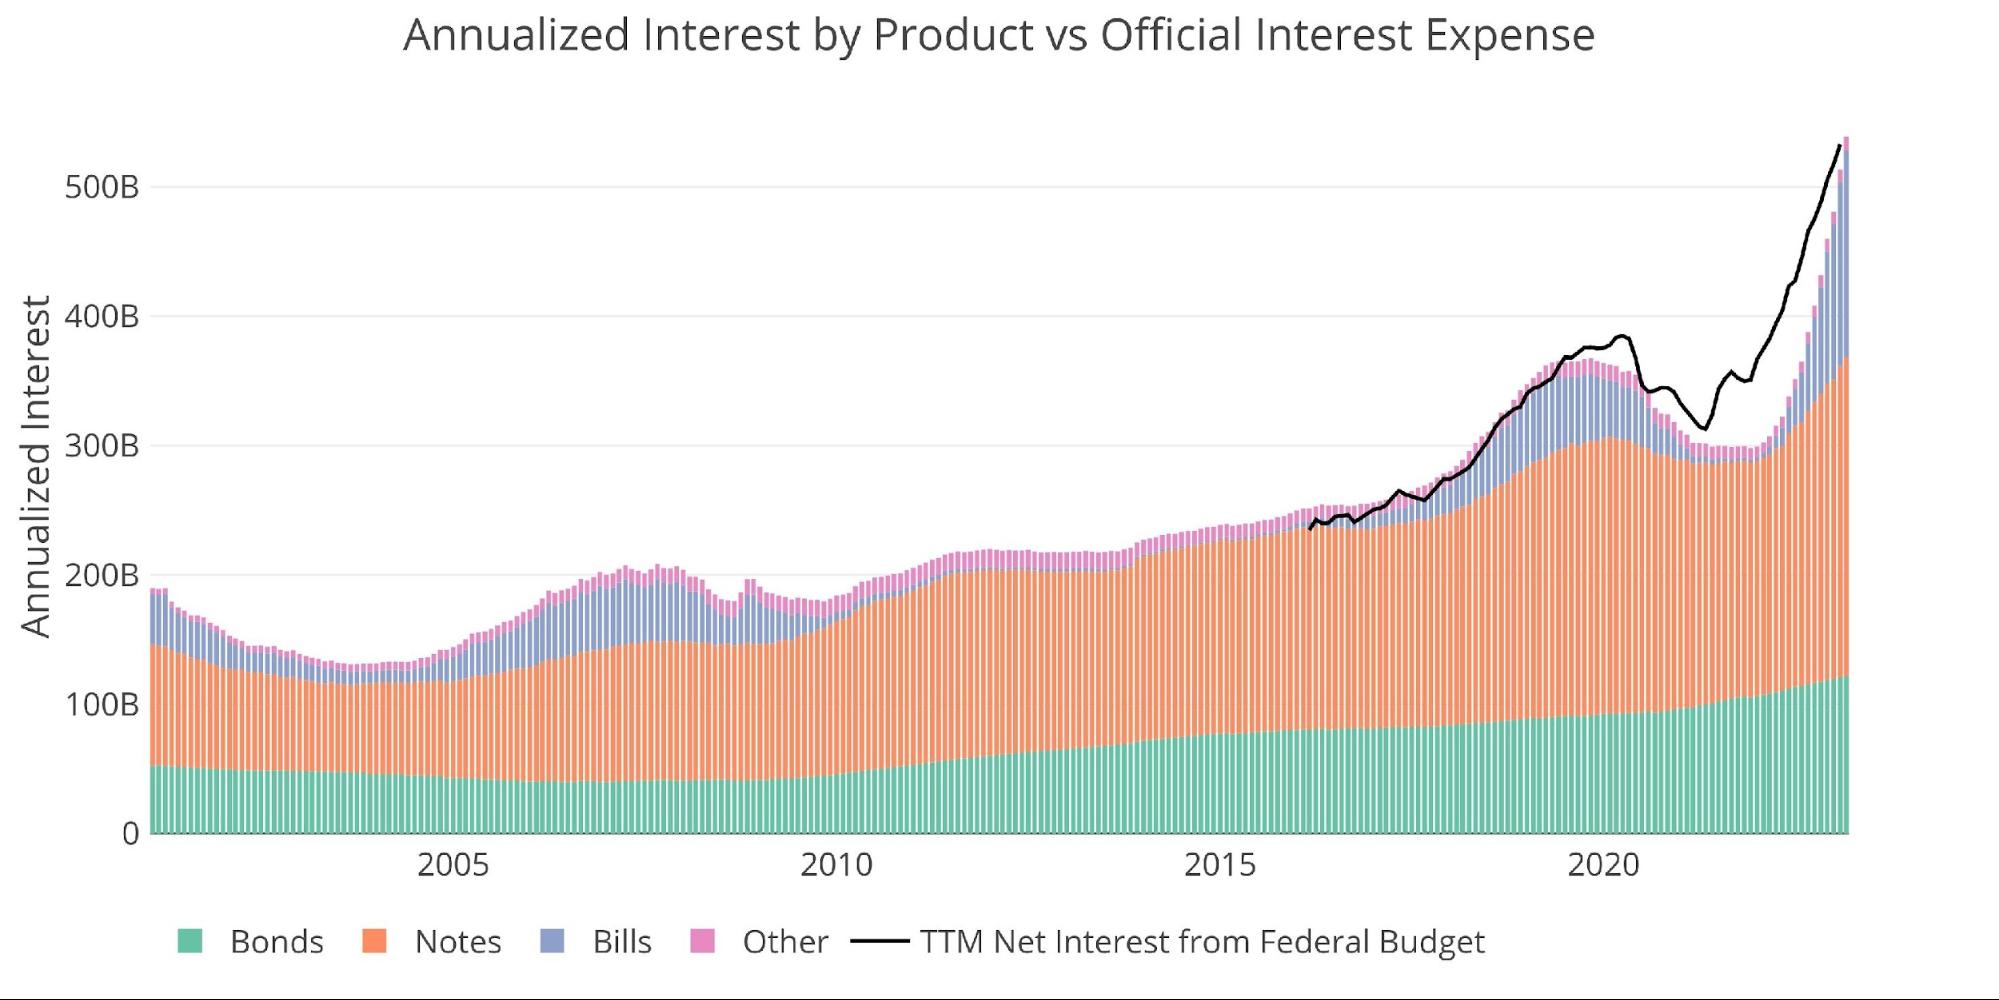
Figure: 5 Net Interest Expense
More concerning is the trajectory of the move. Even though the Fed is getting ready to slow the pace of interest rate hikes, it does not mean that debt servicing costs are set to slow. As the chart below shows, more debt will be rolling over at the higher rates.
As shown above in Figure 3, the average weighted interest rate is 2.22%. The entire yield curve is near or above 4%. As debt rolls over and new debt is issued, interest costs continue to rise even if the Fed doesn’t hike rates anymore. Based on the current trajectory, by this time next year, debt interest costs could exceed $750B!
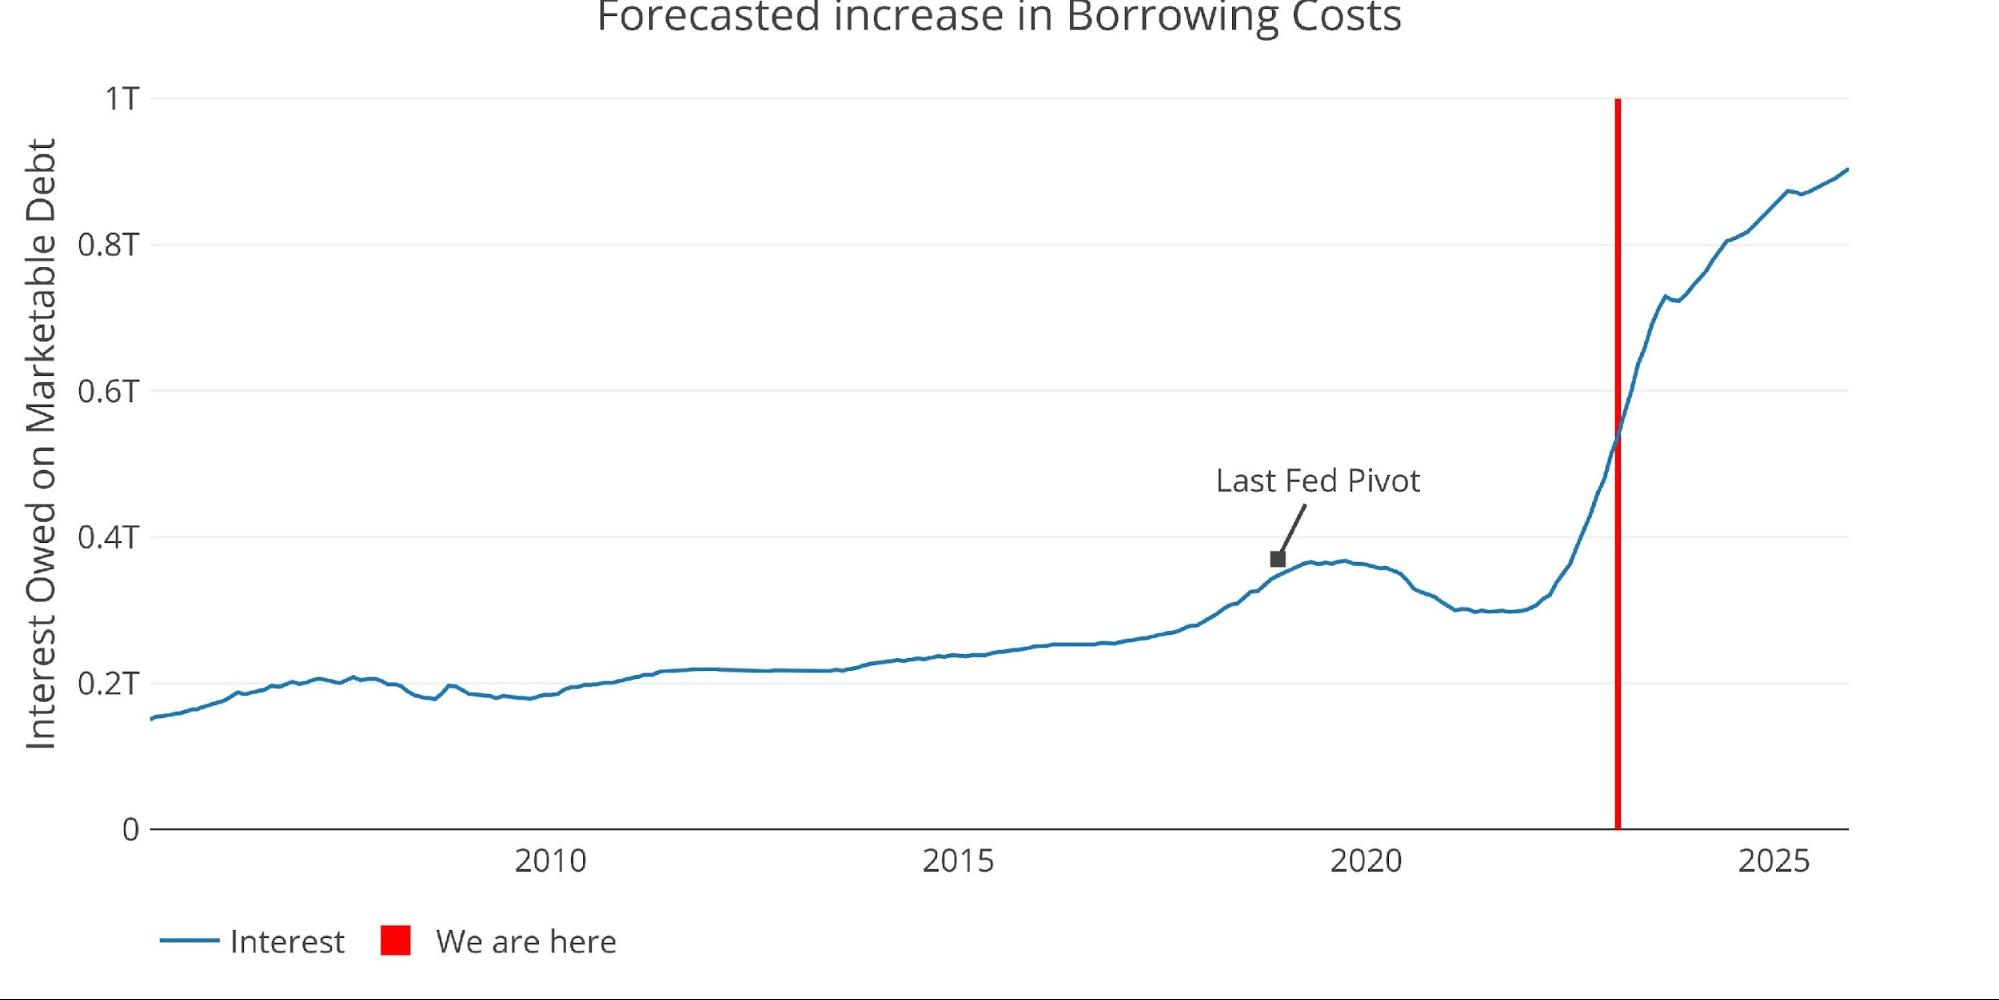
Figure: 6 Projected Net Interest Expense
The rollover of the debt can be seen below. Most of the near-term rollover will be Bills that will be close to the higher rates already. It will be the Notes rolling over that will really drive interest costs.

Figure: 7 Monthly Rollover
Note “Net Change in Debt” is the difference between Debt Issued and Debt Matured. This means when positive it is part of Debt Issued and when negative it represents Debt Matured
The chart below zooms on the annual rollover of Notes. As shown, almost $2.5T still needs to rollover this year with nearly $3T set to rollover in 2024. This is driving the upcoming surge in interest expense. The Notes rolling over will be of 2-10 year maturities so will be locked in at very low, near-zero rates. When they rollover, they will drive massive increases in Net Interest expense. Keep in mind that this is existing debt that needs to rollover so it is coming with or without the debt ceiling debate.
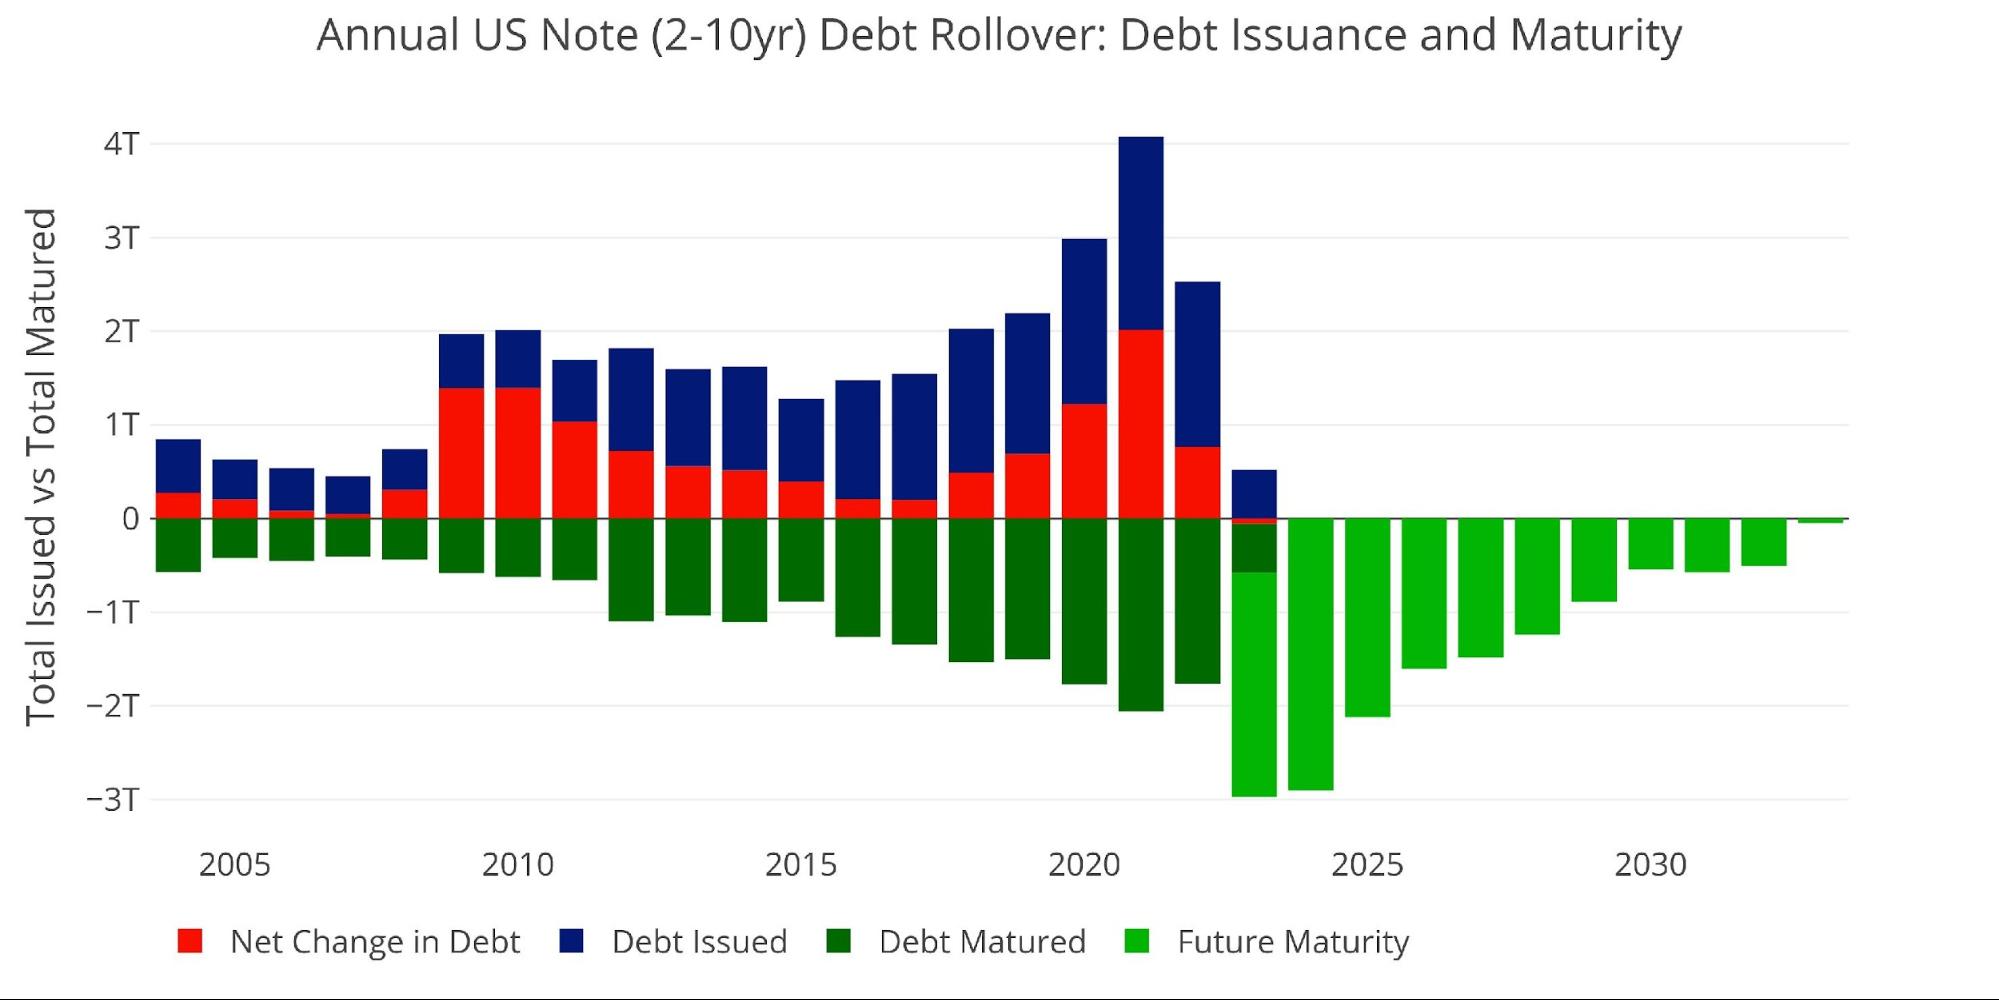
Figure: 8 Treasury Note Rollover
Digging into the Debt
The table below summarizes the total debt outstanding. A few key takeaways:
On a monthly basis:
-
- The big move can be seen in 6-month maturities, adding $165B
- 1-3 year Notes were replaced with 3-20+ year debt which seems odd given the Treasury would probably not want to lock in the current rates for longer
On a TTM Basis:
-
- Debt issuance is clearly down, falling from $2.4T to $1.2T
-
- It should be noted that $1.2T is still a lot of debt issuance
-
- This pales in comparison to the $4.5T issued in the 12-month period ending in Feb 2021
- Debt issuance is clearly down, falling from $2.4T to $1.2T
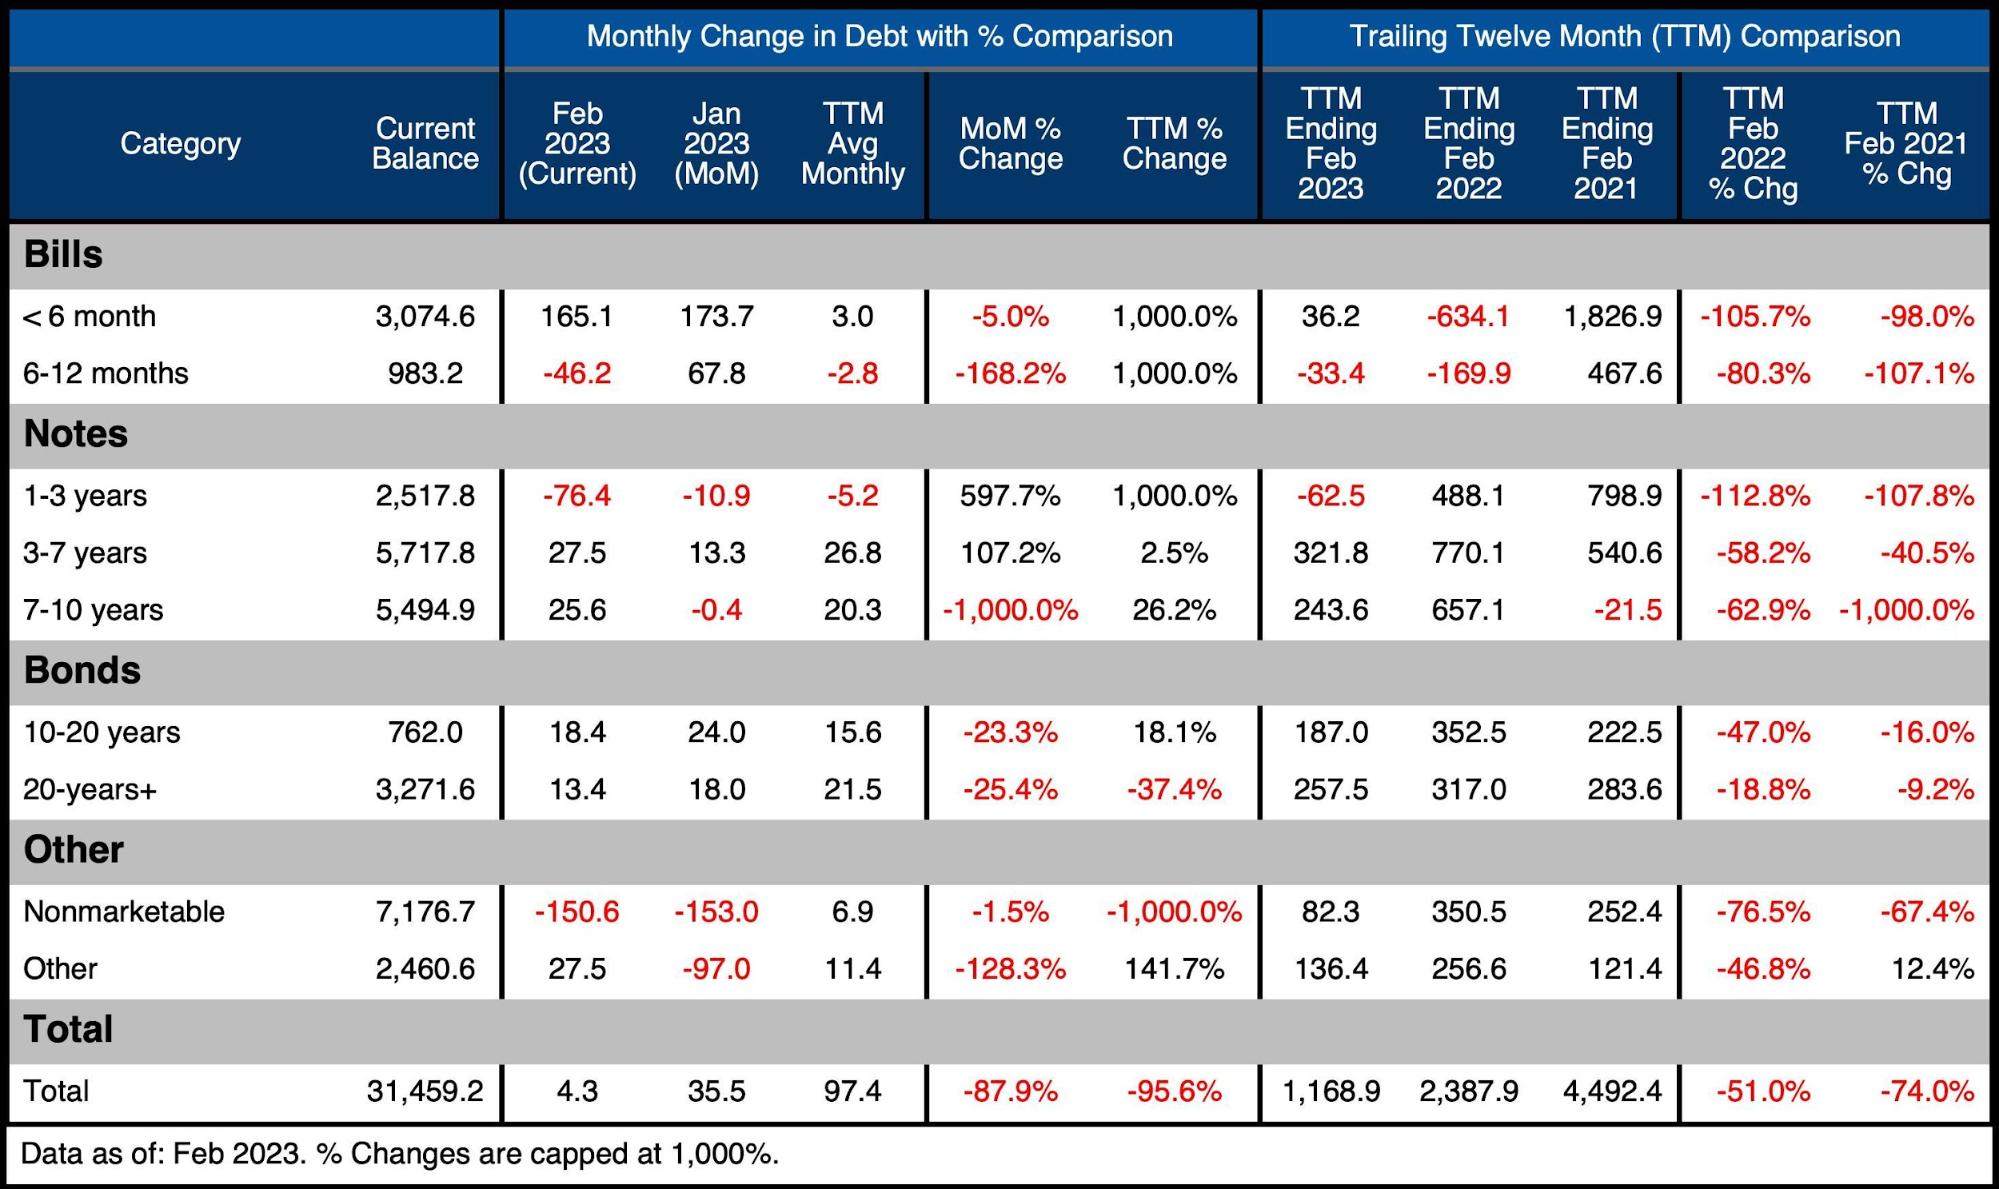
Figure: 9 Recent Debt Breakdown
A Looming Recession
Debt issuance might be going back up as the US economy enters a potentially brutal recession. The yield curve is certainly screaming recession and it remains deeply inverted with the 10-year more than 90bps below the 2-year.
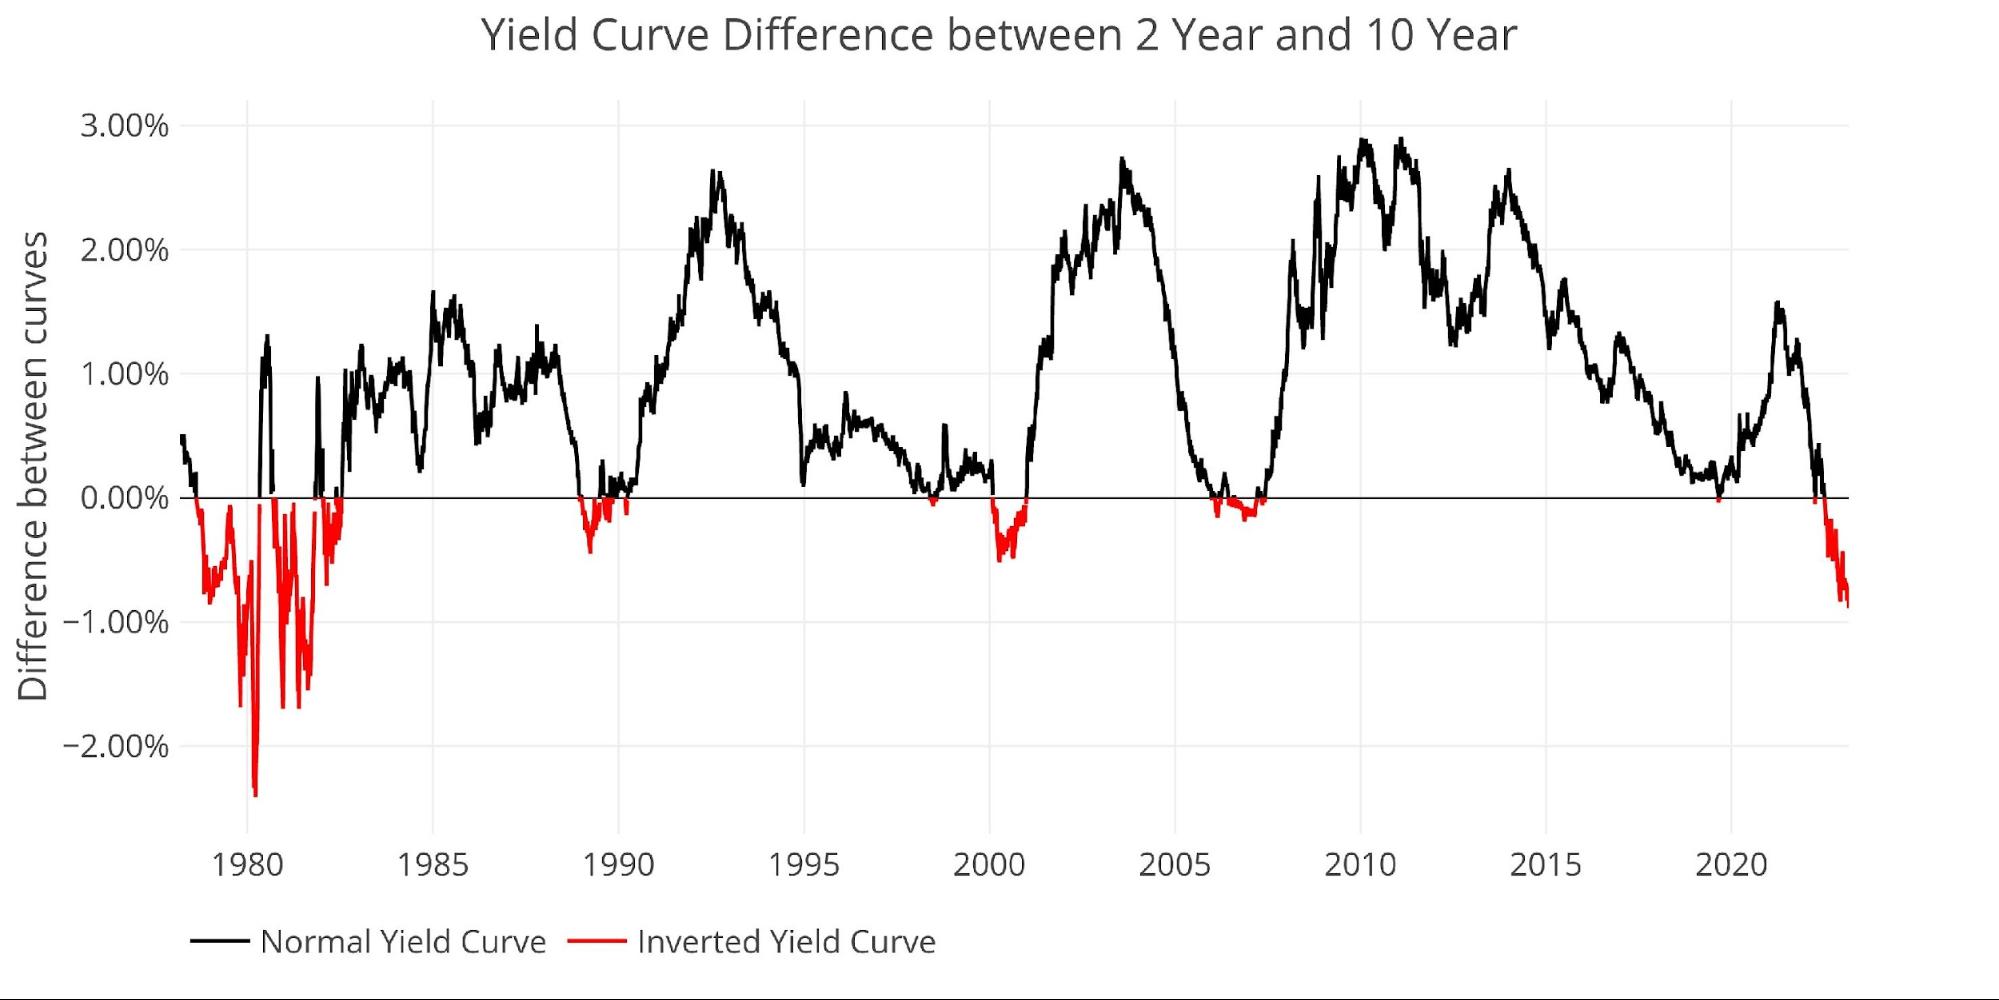
Figure: 10 Tracking Yield Curve Inversion
One interesting data point is the surge in the divergence in the Bid-to-Cover for 2 and 10-year Notes. The falling appetite for short-term debt against the increased appetite for long-term debt suggests that the Treasury may be issuing too much short-term debt and/or the market is trying to lock in the higher rates for longer.
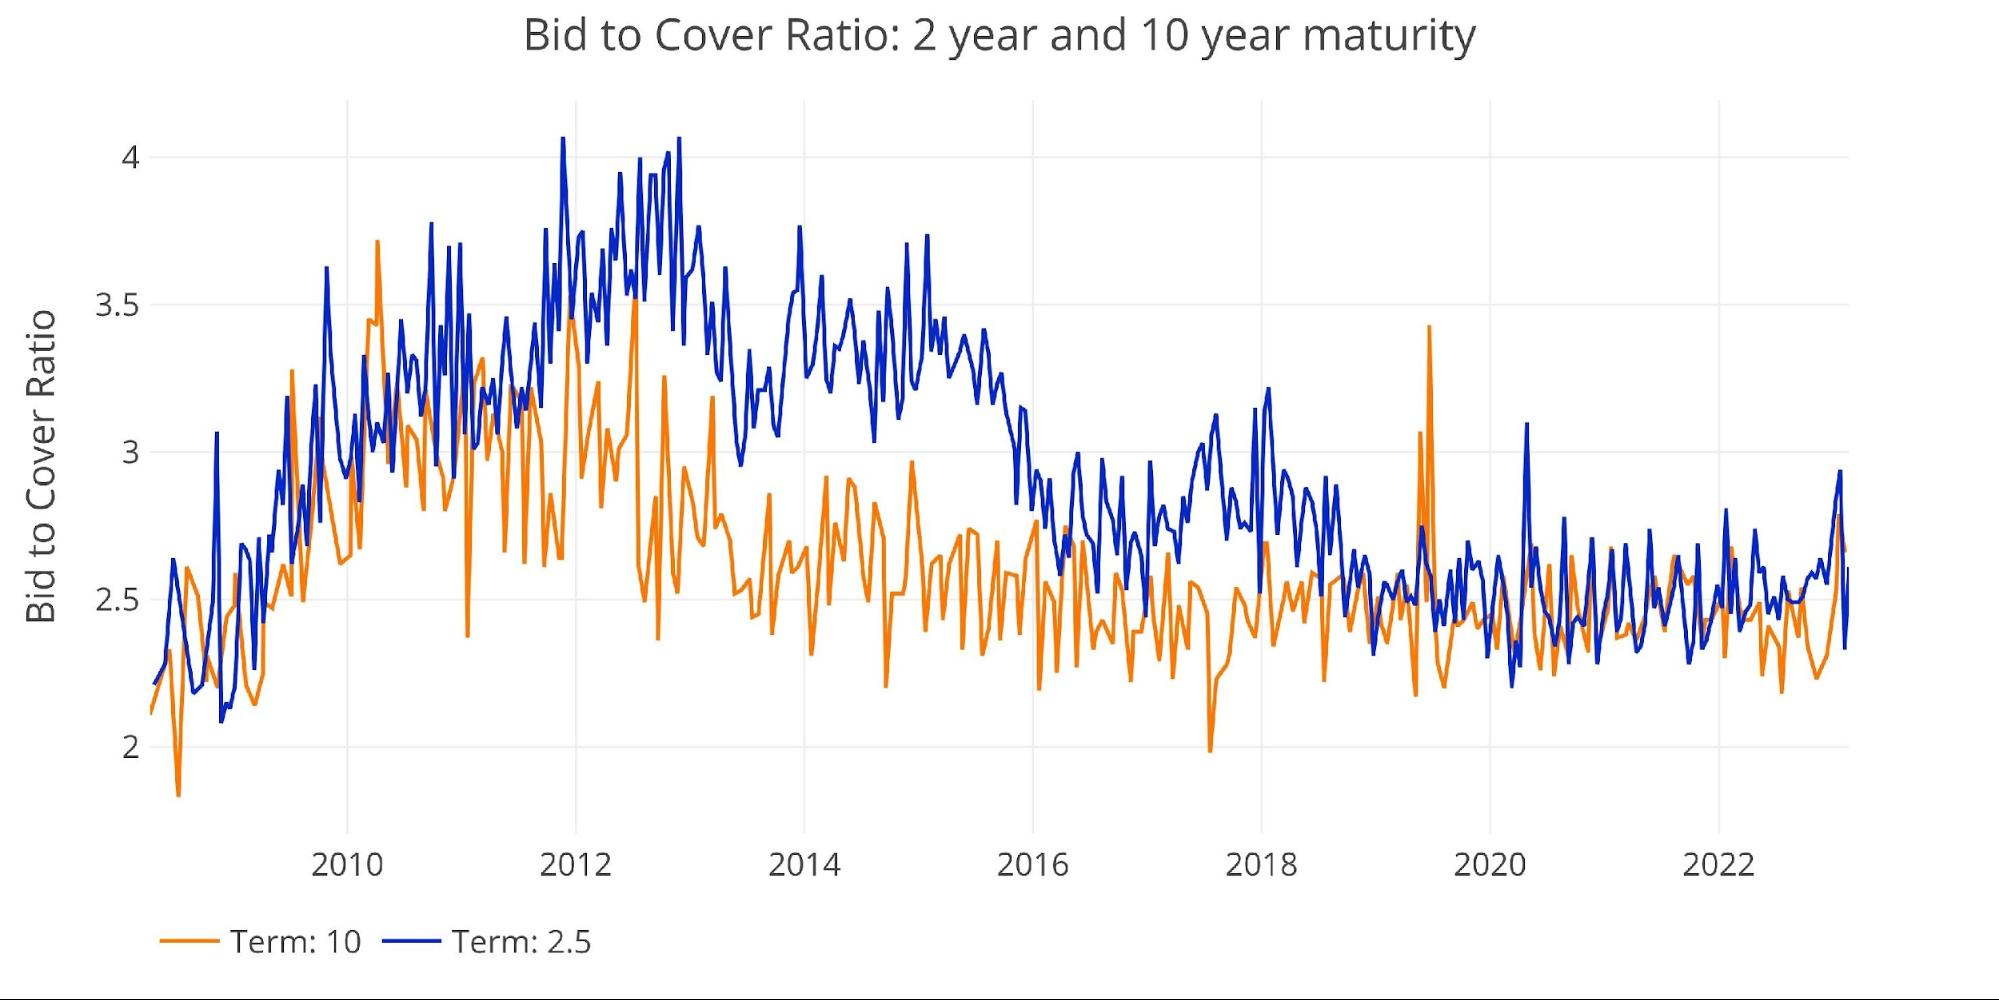
Figure: 11 2-year and 10-year bid to cover
Historical Perspective
While total debt now exceeds $31T, not all of it poses a risk to the Treasury. There is $7.5T+ of Non-Marketable securities which are debt instruments that cannot be resold and the government typically owes itself (e.g., Social Security).
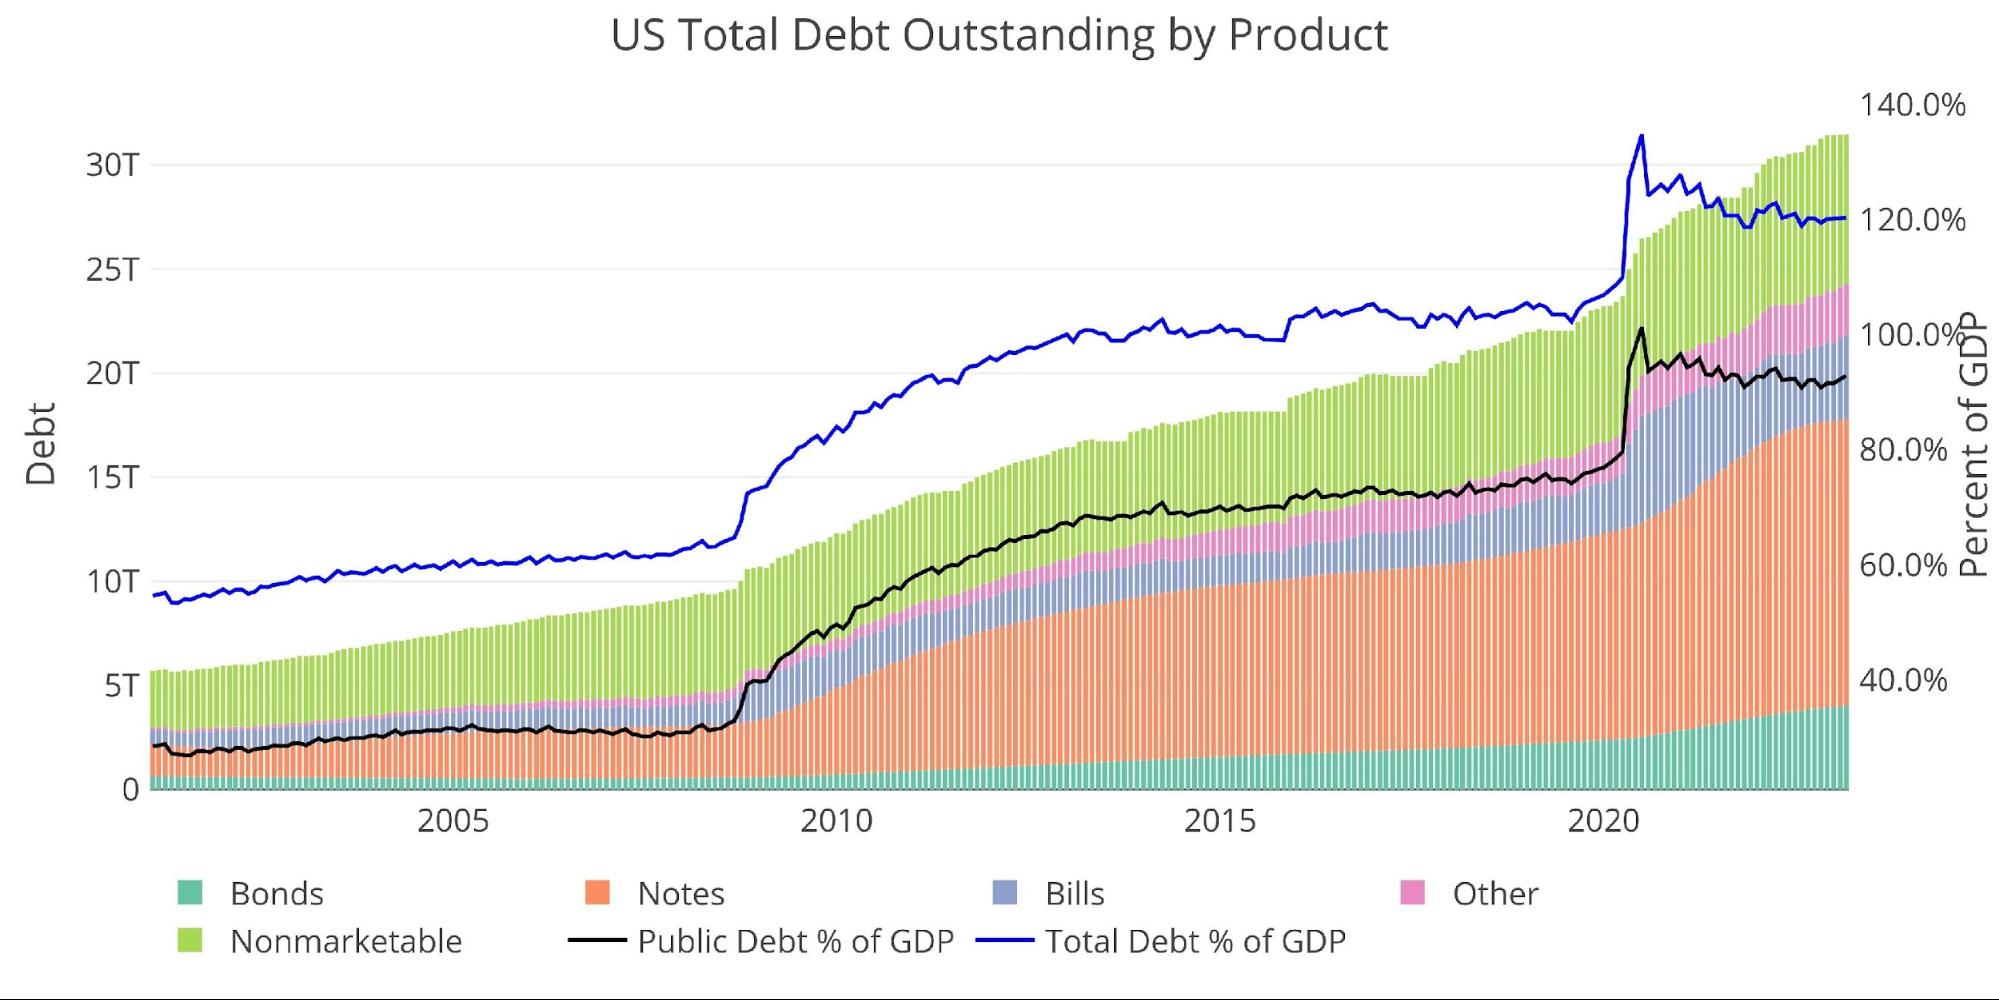
Figure: 12 Total Debt Outstanding
Unfortunately, the reprieve offered by Non-Marketable securities has been fairly limited in recent years, as the Treasury has been forced to rely more heavily on private markets. This has made Non-Marketable fall from over 50% of the debt to less than 23% of total debt outstanding.
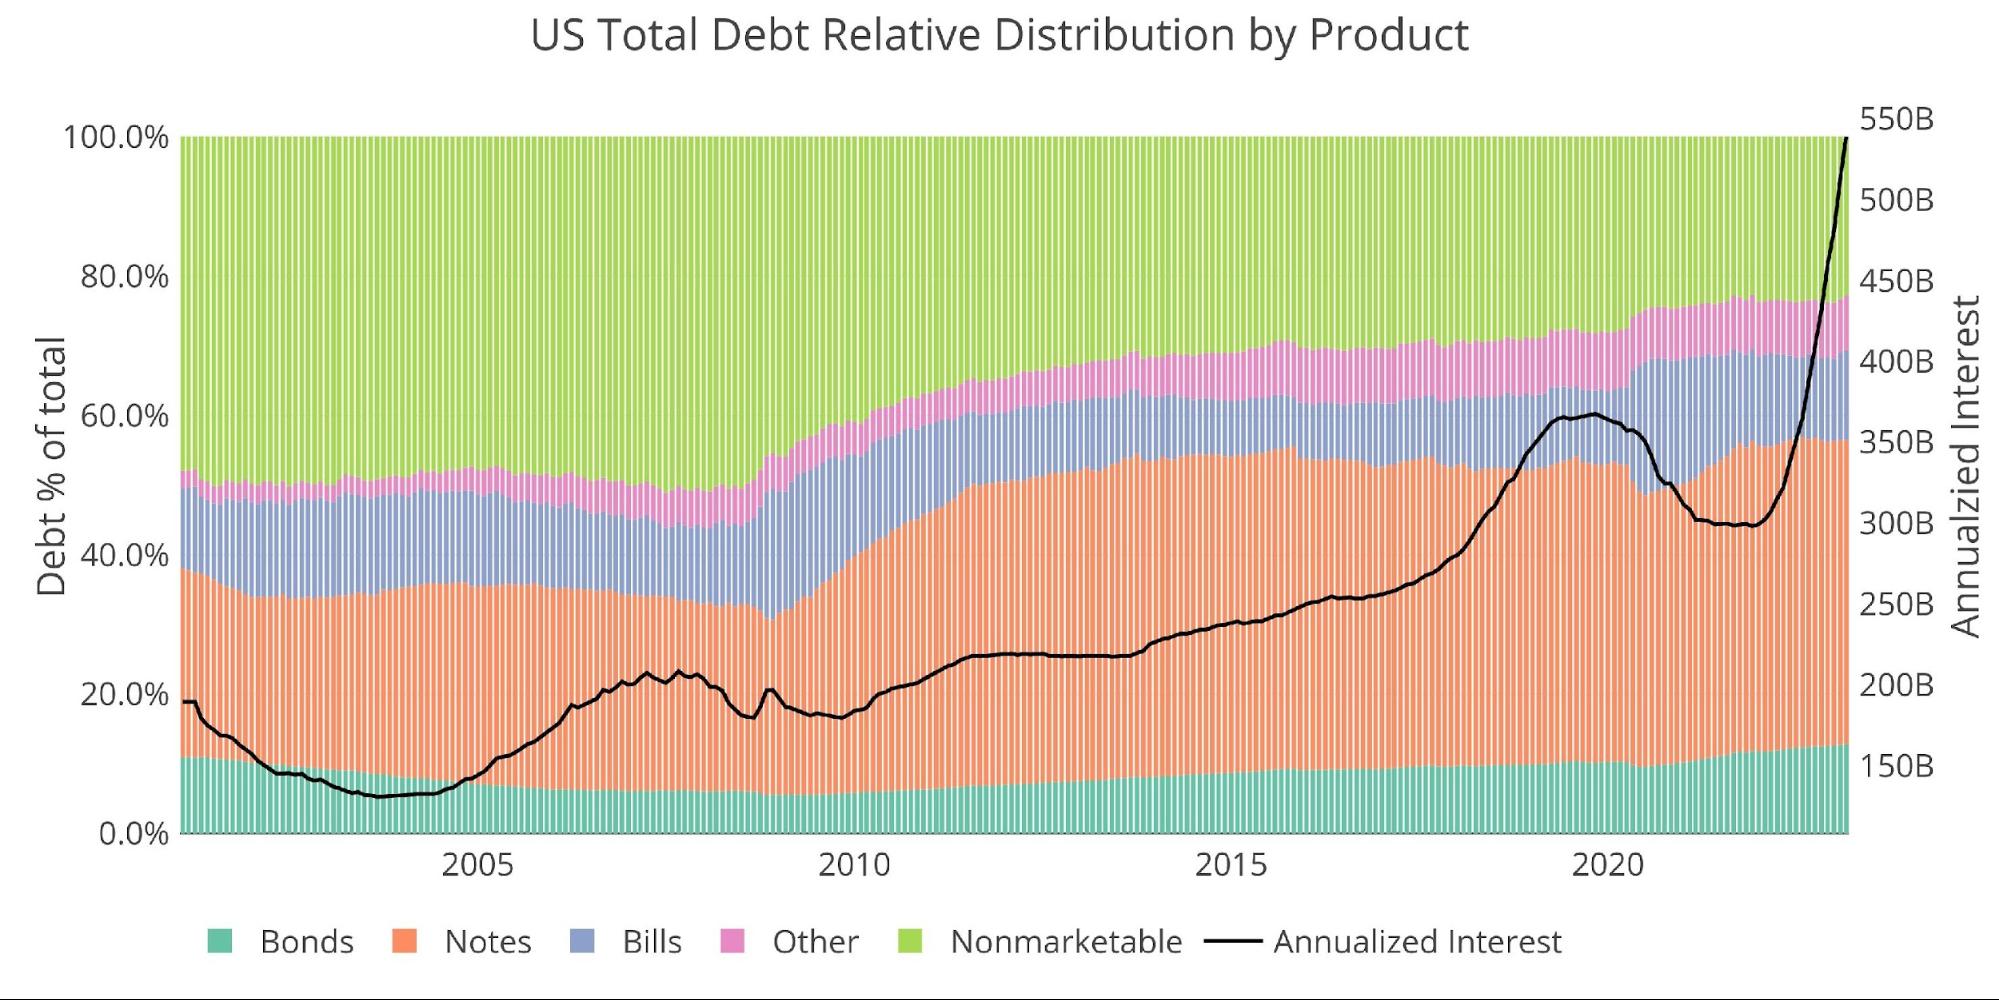
Figure: 13 Total Debt Outstanding
Historical Debt Issuance Analysis
The table below breaks down the trends shown above with specific numbers.
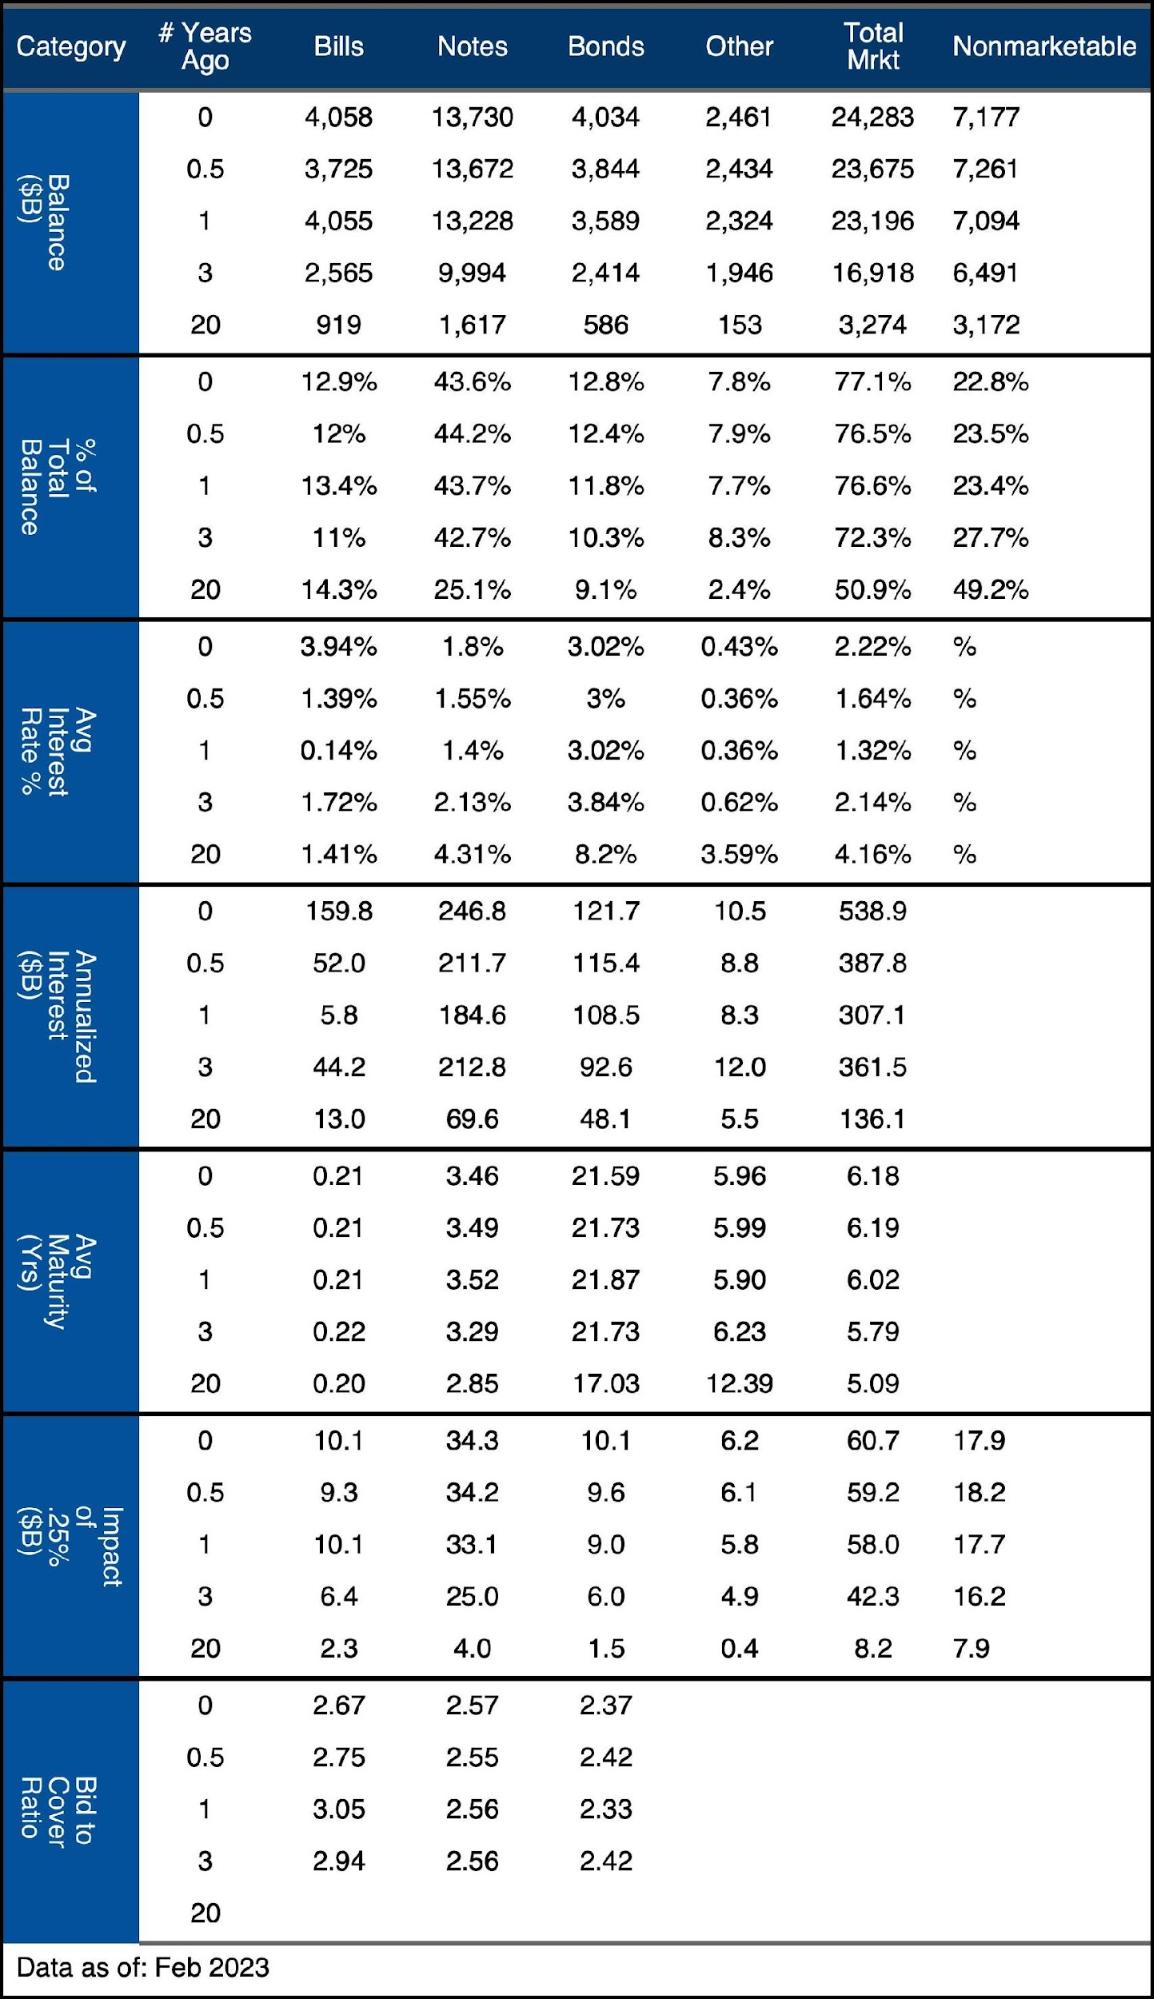
Figure: 14 Debt Details over 20 years
It can take time to digest all the data above. Below are some main takeaways:
-
- Annualized interest has surged by over $100B on Bills but only $35B on Notes
-
- Considering the balance on Notes is more than 3 times the size, this means the impact on Notes has barely begun
-
- The average interest on Notes is only 1.8%, up from 1.4% a year ago
-
- This is less than half of the yield currently on Notes across the yield curve
-
- Every 25bps increase on Notes will have a fully loaded effect of $34B increased interest expense
-
- This means if average interest on Notes reached 3.8% (still below current levels), then that would translate to an additional $272B of interest expense per year
-
- Annualized interest has surged by over $100B on Bills but only $35B on Notes
Wrapping Up
The math is pretty simple here and it shows the Treasury cannot handle a prolonged inflation fight. This is why Powell has to talk so toughly, because he can’t really act tough. Sure, he has played the part so far, but if he hadn’t, the whole world would know that he was bluffing. He has been trying to win back credibility, but the issue he faces is that inflation might not be coming back down to 2% anytime soon. In fact, it is very unlikely this will happen.
Powell is praying for a quick fight so he can get rates back down and not let the math shown above destroy the Treasury. If Powell has to repeat Volker and keep rates elevated for several years, the Treasury won’t be able to handle it. That said, it’s much more likely something breaks in the economy long before the Treasury enters a death spiral. Considering that the death spiral is in view, we are likely to see something break in the very near future. That is when the money printing goes back into high gear and inflation sees new highs. That is also when gold and silver go parabolic.