The past quarter-century has reshaped the global economic landscape, with massive gains in living standards across emerging Asia and parts of Eastern Europe.
This article was written by Niccolo Conte and originally published by Visual Capitalist.
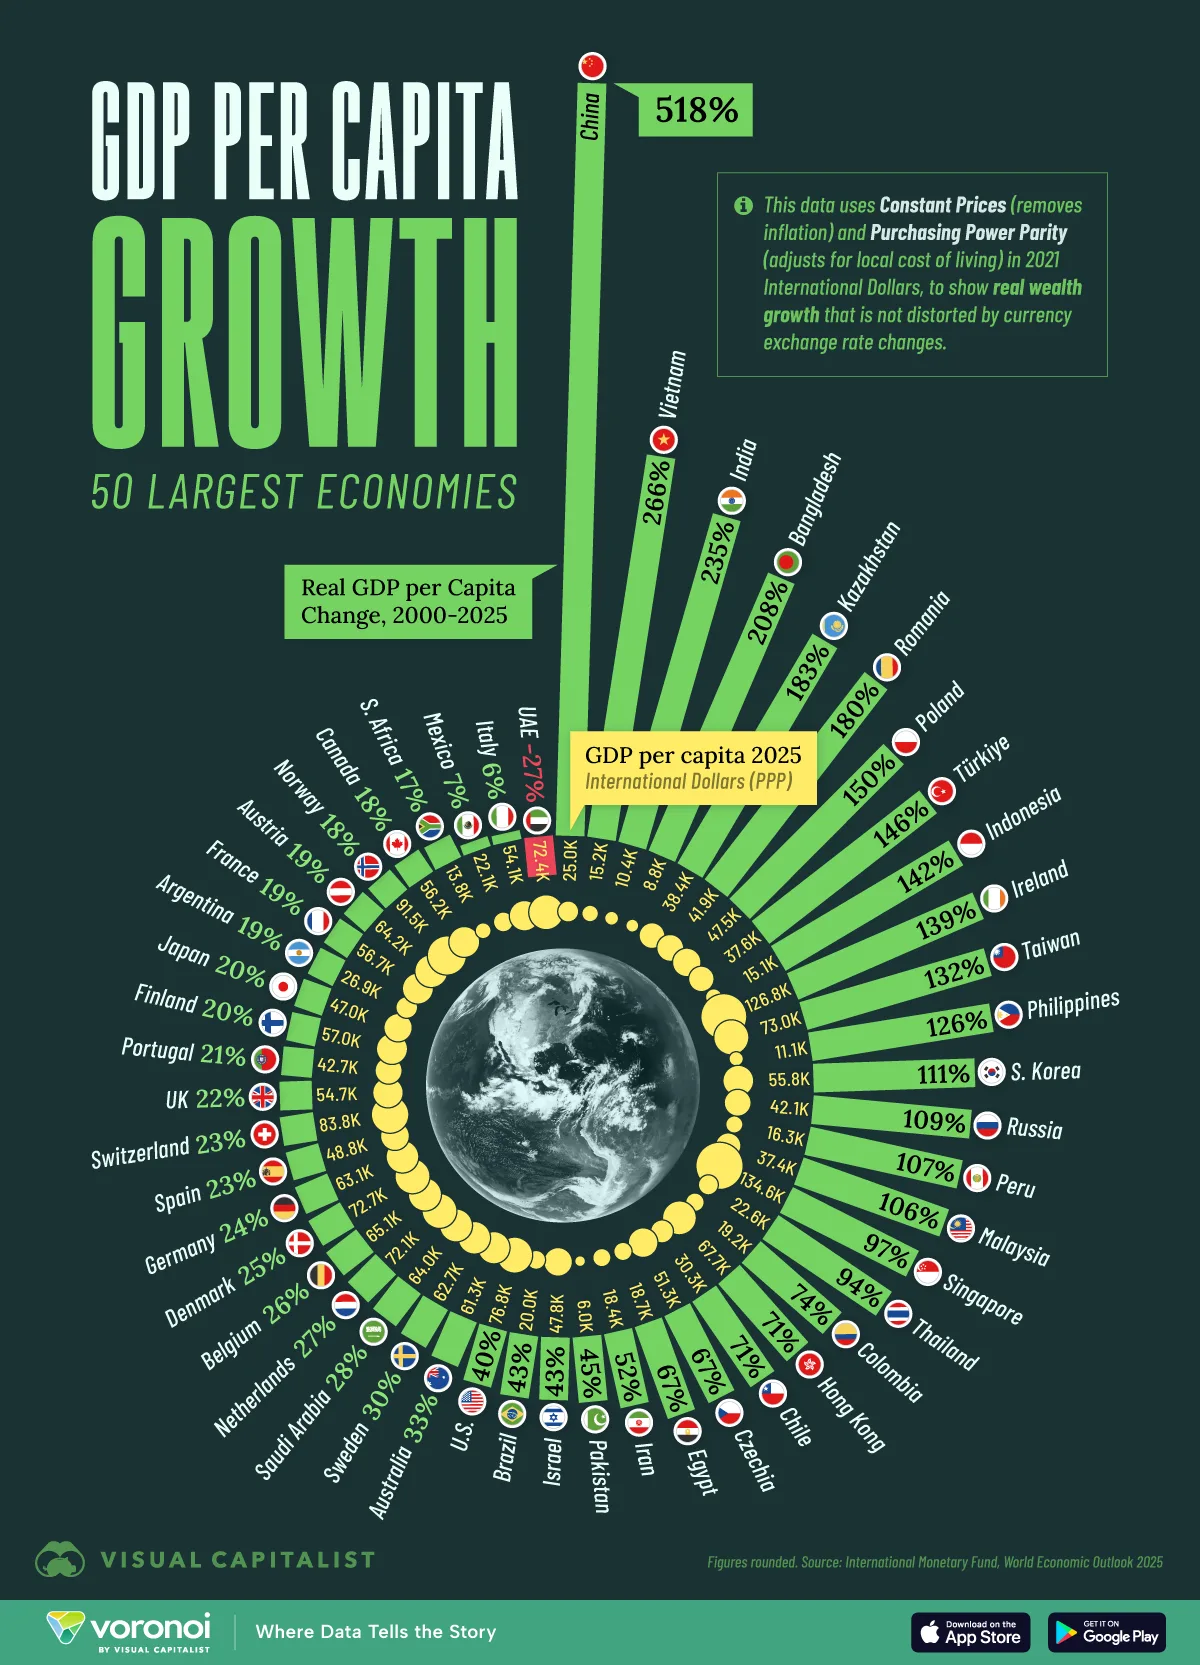
Real GDP per capita growth highlights how quickly countries have expanded economic output per person—one of the clearest long-term indicators of rising prosperity.
This visualization ranks the top 50 economies in GDP terms by real GDP per capita growth since 2000 using data from the International Monetary Fund, and shows where living standards have improved the most.
Data & Discussion
The data for this ranking uses constant prices, which remove inflation, and purchasing power parity (PPP) in 2021 international dollars, which adjusts for differences in cost of living. Together, these methods show real changes in wealth that are not distorted by currency swings or price-level differences between countries.
The data table below shows the top 50 global economies by GDP in 2025, ranked by real GDP per capita growth since 2000 along with their real GDP per capita value in 2025:
|
Rank
|
Country
|
Real GDP per Capita Growth (2000-2025)
|
Real GDP per Capita 2025
|
|---|---|---|---|
| 1 | 🇨🇳 China | 518% | $25,035 |
| 2 | 🇻🇳 Vietnam | 266% | $15,170 |
| 3 | 🇮🇳 India | 235% | $10,378 |
| 4 | 🇧🇩 Bangladesh | 208% | $8,797 |
| 5 | 🇰🇿 Kazakhstan | 183% | $38,402 |
| 6 | 🇷🇴 Romania | 180% | $41,893 |
| 7 | 🇵🇱 Poland | 150% | $47,461 |
| 8 | 🇹🇷 Türkiye | 146% | $37,552 |
| 9 | 🇮🇩 Indonesia | 142% | $15,123 |
| 10 | 🇮🇪 Ireland | 139% | $126,823 |
|
Rank
|
Country
|
Real GDP per Capita Growth (2000-2025)
|
Real GDP per Capita 2025
|
|---|---|---|---|
| 11 | 🇹🇼 Taiwan | 132% | $73,007 |
| 12 | 🇵🇭 Philippines | 126% | $11,080 |
| 13 | 🇰🇷 South Korea | 111% | $55,814 |
| 14 | 🇷🇺 Russia | 109% | $42,065 |
| 15 | 🇵🇪 Peru | 107% | $16,278 |
| 16 | 🇲🇾 Malaysia | 106% | $37,448 |
| 17 | 🇸🇬 Singapore | 97% | $134,620 |
| 18 | 🇹🇭 Thailand | 94% | $22,606 |
| 19 | 🇨🇴 Colombia | 74% | $19,207 |
| 20 | 🇭🇰 Hong Kong | 71% | $67,682 |
|
Rank
|
Country
|
Real GDP per Capita Growth (2000-2025)
|
Real GDP per Capita 2025
|
|---|---|---|---|
| 21 | 🇨🇱 Chile | 71% | $30,262 |
| 22 | 🇨🇿 Czechia | 67% | $51,331 |
| 23 | 🇪🇬 Egypt | 67% | $18,661 |
| 24 | 🇮🇷 Iran | 52% | $18,416 |
| 25 | 🇵🇰 Pakistan | 45% | $5,960 |
| 26 | 🇮🇱 Israel | 43% | $47,826 |
| 27 | 🇧🇷 Brazil | 43% | $19,991 |
| 28 | 🇺🇸 United States | 40% | $76,842 |
| 29 | 🇦🇺 Australia | 33% | $61,261 |
| 30 | 🇸🇪 Sweden | 30% | $62,666 |
|
Rank
|
Country
|
Real GDP per Capita Growth (2000-2025)
|
Real GDP per Capita 2025
|
|---|---|---|---|
| 31 | 🇸🇦 Saudi Arabia | 28% | $64,037 |
| 32 | 🇳🇱 Netherlands | 27% | $72,070 |
| 33 | 🇧🇪 Belgium | 26% | $65,078 |
| 34 | 🇩🇰 Denmark | 25% | $72,694 |
| 35 | 🇩🇪 Germany | 24% | $63,081 |
| 36 | 🇪🇸 Spain | 23% | $48,788 |
| 37 | 🇨🇭 Switzerland | 23% | $83,755 |
| 38 | 🇬🇧 United Kingdom | 22% | $54,681 |
| 39 | 🇵🇹 Portugal | 21% | $42,669 |
| 40 | 🇫🇮 Finland | 20% | $57,042 |
|
Rank
|
Country
|
Real GDP per Capita Growth (2000-2025)
|
Real GDP per Capita 2025
|
|---|---|---|---|
| 41 | 🇯🇵 Japan | 20% | $47,011 |
| 42 | 🇦🇷 Argentina | 19% | $26,853 |
| 43 | 🇫🇷 France | 19% | $56,655 |
| 44 | 🇦🇹 Austria | 19% | $64,195 |
| 45 | 🇳🇴 Norway | 18% | $91,503 |
| 46 | 🇨🇦 Canada | 18% | $56,174 |
| 47 | 🇿🇦 South Africa | 17% | $13,765 |
| 48 | 🇲🇽 Mexico | 7% | $22,101 |
| 49 | 🇮🇹 Italy | 6% | $54,138 |
| 50 | 🇦🇪 United Arab Emirates | -27% | $72,386 |
Among the top performers, China leads with a 518% increase in real GDP per capita, followed by Vietnam (266%), India (235%), Bangladesh (208%), and Kazakhstan (183%).
These economies experienced rapid industrialization, export-driven growth, and significant structural transformation over the past 25 years.
Asia’s Boom in Real GDP per Capita (2000-2025)
Asia dominates the top of the ranking, with the five fastest growing economies on a real GDP per capita basis, and holding 14 of the top 20 spots.
China’s rise stands out above all other countries, with real GDP per capita reaching $25,035 in 2025, up 518% from just $4,050 since 2000.
Vietnam (266%) and Bangladesh (208%) also show substantial gains as they developed competitive manufacturing sectors and integrated more deeply into global trade networks.
India’s 235% growth highlights the benefits of economic liberalization, demographic momentum, and expanding services industries.
Together, these four Asian economies have reshaped global growth and trade since 2000, accounting for a large share of the rise in world output during the 21st century.
Eastern Europe’s Catch-Up Growth
Several Eastern European countries show strong convergence toward Western European living standards.
Romania’s real GDP per capita grew 180% from 2000 to 2025, while Poland grew 150%. Both of these countries more than doubled their GDP per capita to reach over $41,893.
Czechia is another European country that showed high levels of growth since 2000 at 67%, lifting its GDP per capita from $30,700 to $51,331.
EU accession (2004 for Czechia and Poland, and 2007 for Romania), increased investment, and productivity gains fueled this 25-year catch-up phase for these three countries.
UAE’s GDP per Capita Decline Driven by Population Surge
Not all of the world’s 50 largest economies in terms of GDP saw gains in real GDP per capita since 2000.
The United Arab Emirates experienced a decline in real GDP per capita, falling from about $99,000 in 2000 to $72,386 in 2025. This was primarily driven by a rapid increase in population, which surged from 3.5 million in 2000 to 11.35 million by 2025.
With economic output spread across a much larger population, real GDP per person decreased even as total economic activity expanded.