In blue states, the median income isn’t rising enough to keep up with the cost of living.
This article was written by Bruno Venditti and originally published by the Visual Capitalist.
The 2024 U.S. presidential election will be determined by over 186 million voters, but the outcome will likely hinge on a small group in a few key swing states.
Of the 50 states, only seven are truly competitive, with the rest strongly favoring either Democrats or Republicans.
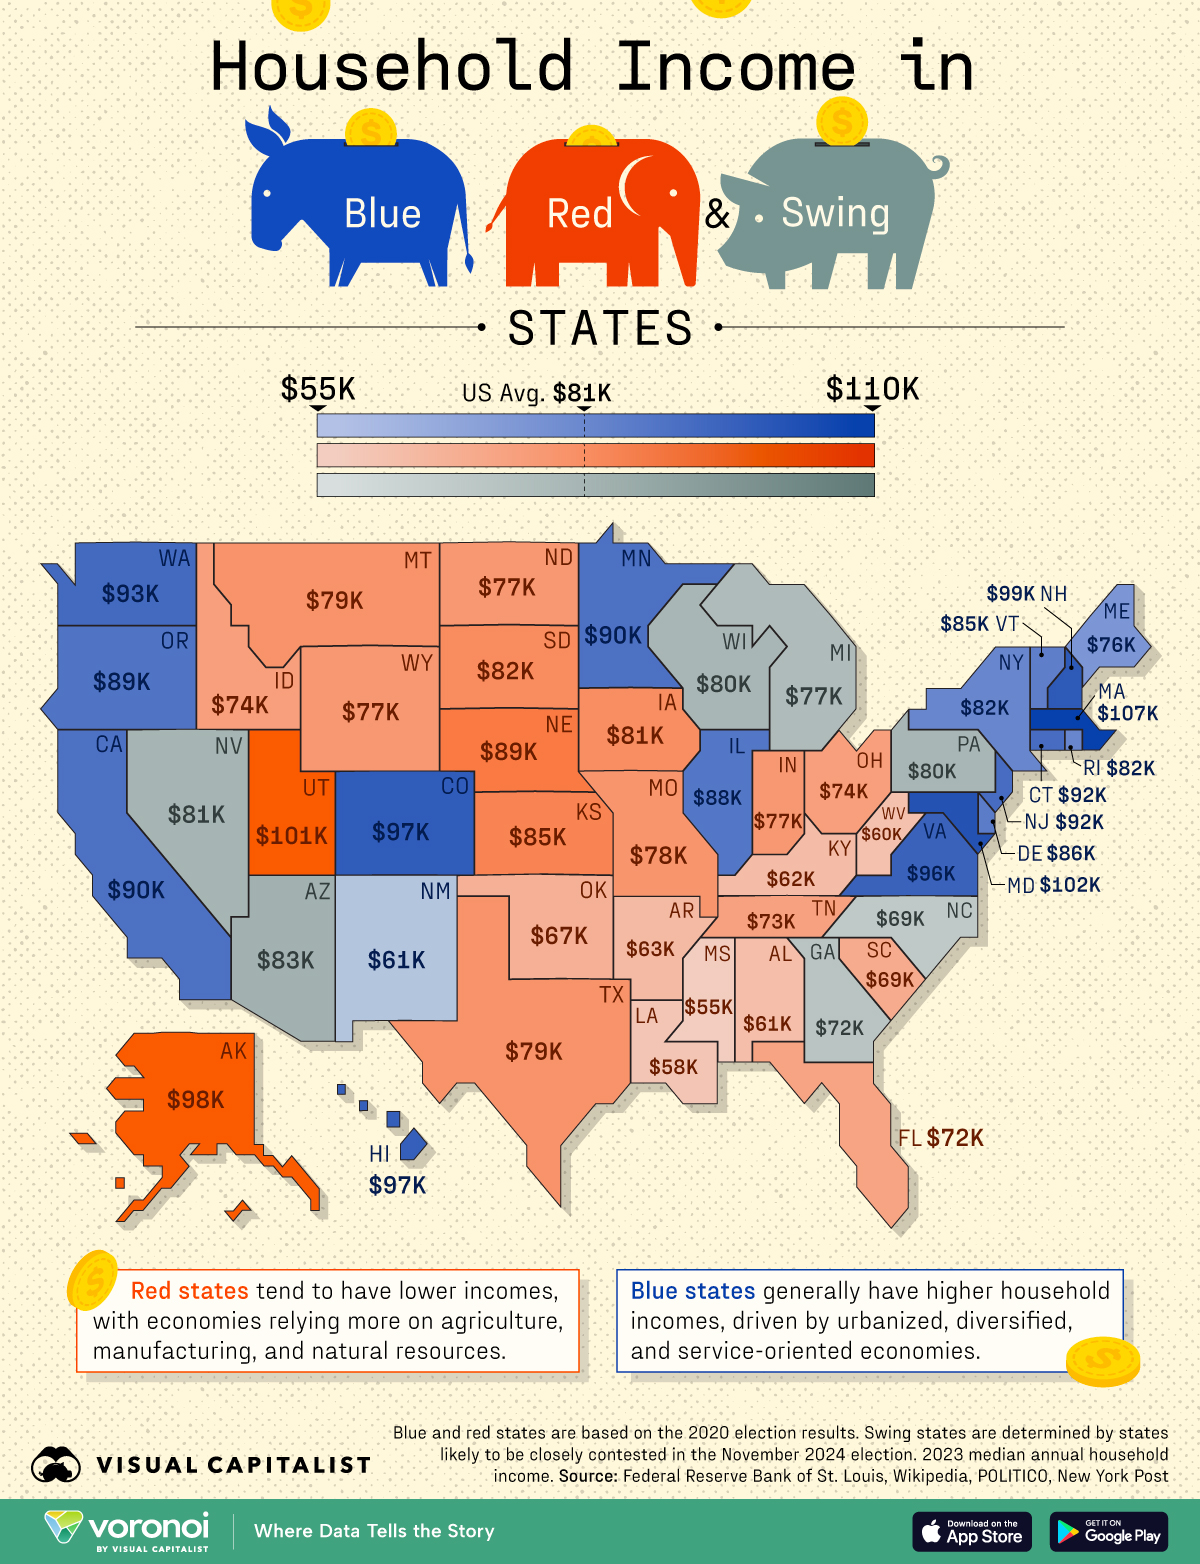
This graphic shows the median household income (2023) by state, categorized into blue (Democratic), red (Republican), and the seven swing states. Data is sourced from the Federal Reserve Bank of St. Louis and various media outlets.
Blue States Generally Have Higher Incomes
Blue states generally have higher household incomes, driven by urbanized, diversified, and service-oriented economies. Many blue states exceed the national median of $81,000, with states like Massachusetts and Maryland reporting average incomes over $100,000 per year.
| Blue States (Democratic) | Household Income (K) | Political Leanings |
|---|---|---|
| Massachusetts | 107K | Blue State |
| Maryland | 102K | Blue State |
| Utah | 101K | Red State |
| New Hampshire | 99K | Blue State |
| Alaska | 98K | Red State |
| Colorado | 97K | Blue State |
| Hawaii | 97K | Blue State |
| Virginia | 96K | Blue State |
| Washington | 93K | Blue State |
| Connecticut | 92K | Blue State |
| New Jersey | 92K | Blue State |
| California | 90K | Blue State |
| Minnesota | 90K | Blue State |
| Oregon | 89K | Blue State |
| Nebraska | 89K | Red State |
| U.S. Average | 81K |
| Blue States (Democratic) | Household Income (K) | Political Leanings |
|---|---|---|
| Illinois | 88K | Blue State |
| Delaware | 86K | Blue State |
| Vermont | 85K | Blue State |
| Kansas | 85K | Red State |
| Arizona | 83K | Swing State |
| New York | 82K | Blue State |
| Rhode Island | 82K | Blue State |
| South Dakota | 82K | Red State |
| Iowa | 81K | Red State |
| Nevada | 81K | Swing State |
| Pennsylvania | 80K | Swing State |
| Wisconsin | 80K | Swing State |
| Montana | 79K | Red State |
| Texas | 79K | Red State |
| Missouri | 78K | Red State |
| U.S. Average | 81K |
In contrast, red states tend to have lower incomes, with economies relying more on agriculture, manufacturing, and natural resources. Several of these states fall below the national average, with Mississippi ($55,000) and Louisiana ($58,000) under $60,000.
However, exceptions exist on both sides. New Mexico, a blue state, has a lower income of $61,000, while Alaska ($98,000) and Utah ($101,000), both red states, have median incomes higher than the national average.